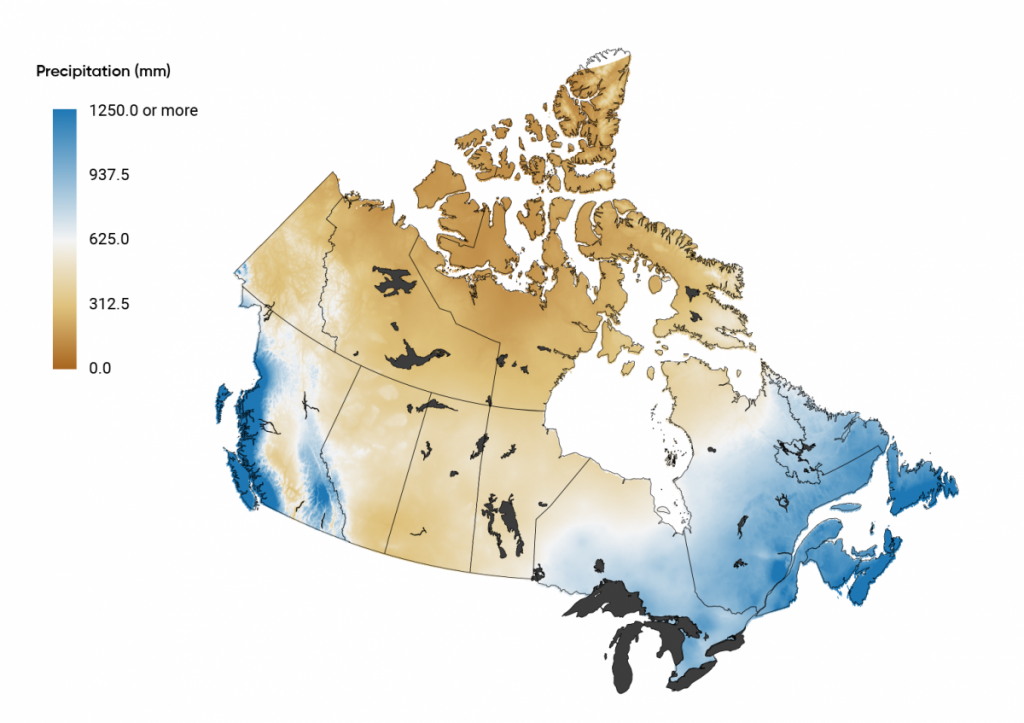
Figure 3.5: Total annual precipitation, average projected for 2021-2050, under a high emissions scenario (RCP 8.5).


Blue areas correspond to areas with significant amounts of precipitation, while brown areas correspond to areas with very low precipitation, increasing the risk of drought.
Prairie Climate Centre, 2019.