Executive Summary

 Canada’s Changing Climate Report, led by Environment and Climate Change Canada, is the first major report of the current National Assessment Canada in a Changing Climate: Advancing our Knowledge for Action, which was launched in 2017.

Authors

  • Elizabeth Bush (Environment and Climate Change Canada)
  • Nathan Gillett (Environment and Climate Change Canada)
  • Barrie R. Bonsal (Environment and Climate Change Canada)
  • Stewart Cohen (Environment and Climate Change Canada)
  • Chris Derksen (Environment and Climate Change Canada)
  • Greg Flato (Environment and Climate Change Canada)
  • Blair J. W. Greenan (Fisheries and Oceans Canada)
  • Marjorie Shepherd (Environment and Climate Change Canada)
  • Xuebin Zhang (Environment and Climate Change Canada)
Figure ES1
View details
Figure ES2
View details
Figure ES3
View details
Figure ES4
View details
Figure ES5
View details
Figure ES6
View details
Figure ES7
View details
Figure ES8
View details
Figure ES9
View details
Figure ES10
View details
 

Introduction

The current National Assessment, Canada in a Changing Climate: Advancing our Knowledge for Action, was launched in 2017. Canada’s Changing Climate Report (CCCR), led by Environment and Climate Change Canada, is the first major report of the current National Assessment. It focuses on answering the questions: how has Canada’s climate changed to date, why, and what changes are projected for the future? Federal government scientists from the departments of Environment and Climate Change Canada, Fisheries and Oceans Canada, and Natural Resources Canada, with contributions from university experts, authored the report, drawing primarily on published peer-reviewed literature. This report provides a climate science foundation for the forthcoming National Assessment reports addressing the impacts of climate change in Canada and how we are adapting to reduce risk. {1.2, 1.3}


Global context

There is overwhelming evidence that the Earth has warmed during the Industrial Era and that the main cause of this warming is human influence. This evidence includes increases in near-surface and lower-atmosphere air temperature, sea surface temperature, and ocean heat content. Widespread warming is consistent with the observed increase in atmospheric water vapour and with declines in snow and ice cover. Global sea level has risen from the expansion of ocean waters caused by warming and from the addition of water previously stored on land in glaciers and ice sheets. The observed warming and other climate changes cannot be explained by natural factors, either internal variations within the climate system or natural external factors such as changes in the sun’s brightness or volcanic eruptions. Only when human influences on climate are accounted for — changes in atmospheric greenhouse gases and aerosols, and changes to the land surface — can these observed changes in climate be explained. Of these human factors, the build-up of atmospheric greenhouse gases, principally carbon dioxide, has been dominant. Attribution studies provide quantitative assessments of the contribution of various climate drivers to observed warming over specified time periods. On the basis of such studies, it is extremely likely that human influences, especially emissions of greenhouse gases, have been the dominant cause of the observed global warming since the mid-20th century. {2.2, 2.3}


Temperature changes

Canada’s climate has warmed and will warm further in the future, driven by human influence1. Both past and future warming in Canada is, on average, about double the magnitude of global warming. Northern Canada has warmed and will continue to warm at even more than double the global rate. {4.2}

Temperature has increased in all regions of Canada and in the surrounding oceans. Since 1948, when nation-wide records became available, Canada’s annual average temperature over land has warmed by a best estimate of 1.7°C, with higher temperature increases observed in the North, the Prairies, and northern British Columbia. Annual average temperature over northern Canada increased by 2.3°C since 1948. The greatest warming has occurred in winter. {4.2}

Figure ES1

Observed changes (°C) in annual temperature across Canada between 1948 and 2016, based on linear trends. From Chapter 4 Figure 4.3.

Figure ES1

Observed changes (°C) in annual temperature across Canada between 1948 and 2016, based on linear trends. From Chapter 4 Figure 4.3.

While both human activities and natural variations in the climate have contributed to the observed warming in Canada, the human factor is dominant. It is likely that more than half of the observed warming in Canada is due to the influence of human activities. {4.2}

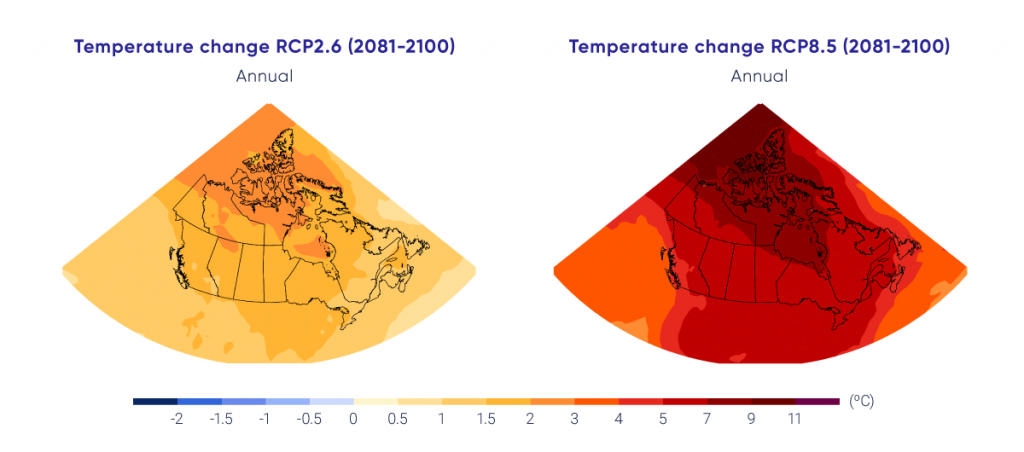
Canada’s climate will warm further, with warming projected in all seasons. Warming globally and for Canada will be similar under all plausible emission pathways over the next two decades. However, efforts to reduce greenhouse gas emissions, beginning in the next two decades and continuing thereafter, will have an increasing impact on the amount of additional warming beyond this time frame. Country-wide annual average temperature projections for the late century (2081–2100) range from an increase of 1.8°C2 for a low emission scenario (RCP2.6) to 6.3°C for a high emission scenario (RCP8.5), compared to the reference period 1986–2005. Only the low emission scenario (RCP2.6) is consistent with holding the increase in the global average temperature to below 2ᵒC above pre-industrial levels, in line with the temperature goal of the Paris Agreement. This scenario requires global emissions to peak almost immediately, with rapid and deep reductions thereafter. {3.2, 3.3, 4.2}

Figure ES2

Projected annual temperature change for Canada this century under a low emission scenario (RCP2.6) and a high emission scenario (RCP8.5). Projections are based on the Coupled Model Intercomparison Project (CMIP5) multi-model ensemble. Changes are relative to the 1986–2005 period. The thin lines show results from individual models and the heavy line is the multi-model mean. […]

Figure ES2

Projected annual temperature change for Canada this century under a low emission scenario (RCP2.6) and a high emission scenario (RCP8.5). Projections are based on the Coupled Model Intercomparison Project (CMIP5) multi-model ensemble. Changes are relative to the 1986–2005 period. The thin lines show results from individual models and the heavy line is the multi-model mean. From Chapter 4 Figure 4.8.


Changes in rainfall and snowfall

Precipitation has increased in many parts of Canada, and there has been a shift toward less snowfall and more rainfall. Annual and winter precipitation is projected to increase everywhere in Canada over the 21st century. However, reductions in summer rainfall are projected for parts of southern Canada under a high emission scenario toward the late century. {4.3}

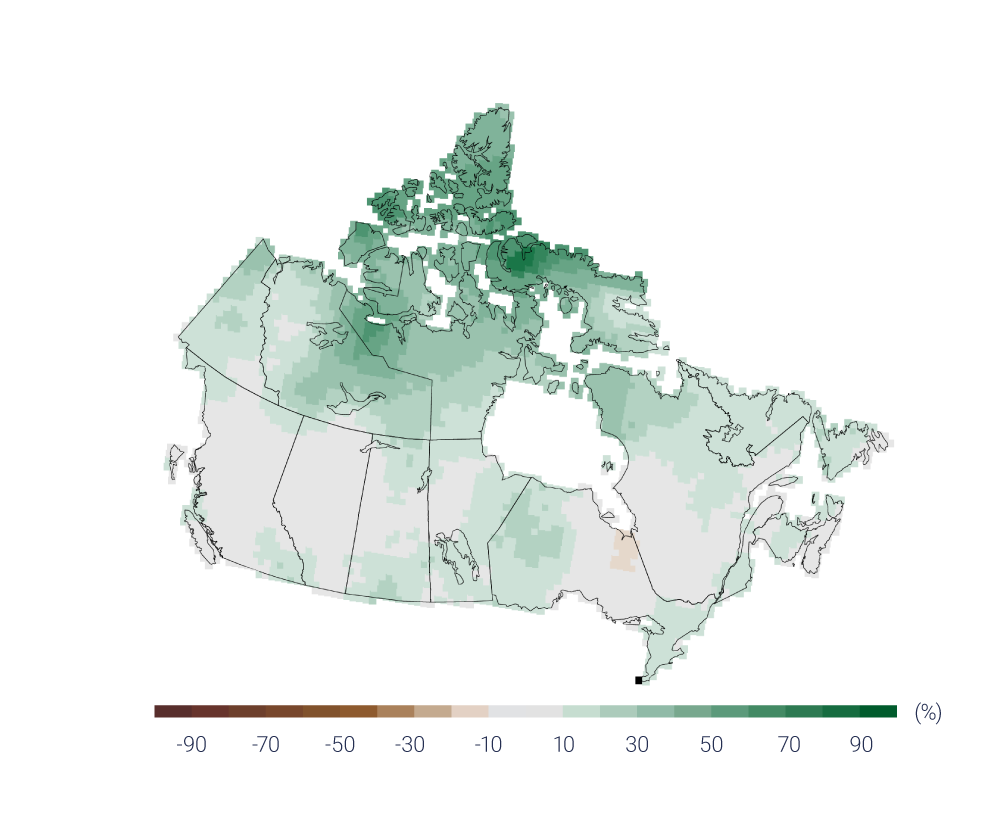
With medium confidence, observations indicate that Canada’s annual precipitation has increased in all regions since 1948, with relatively larger percentage increases in northern Canada and parts of Manitoba, Ontario, northern Quebec, and Atlantic Canada. As a result of warming, snowfall has been reduced as a proportion of total precipitation in southern Canada. Observations also indicate with medium confidence that seasonal snow accumulation has declined over the period of record (1981–2015) on a country-wide basis. {4.3, 5.2}

Figure ES3

Observed changes in annual precipitation across Canada, 1948–2012, based on linear trends. From Chapter 4 Figure 4.15.

Figure ES3

Observed changes in annual precipitation across Canada, 1948–2012, based on linear trends. From Chapter 4 Figure 4.15.

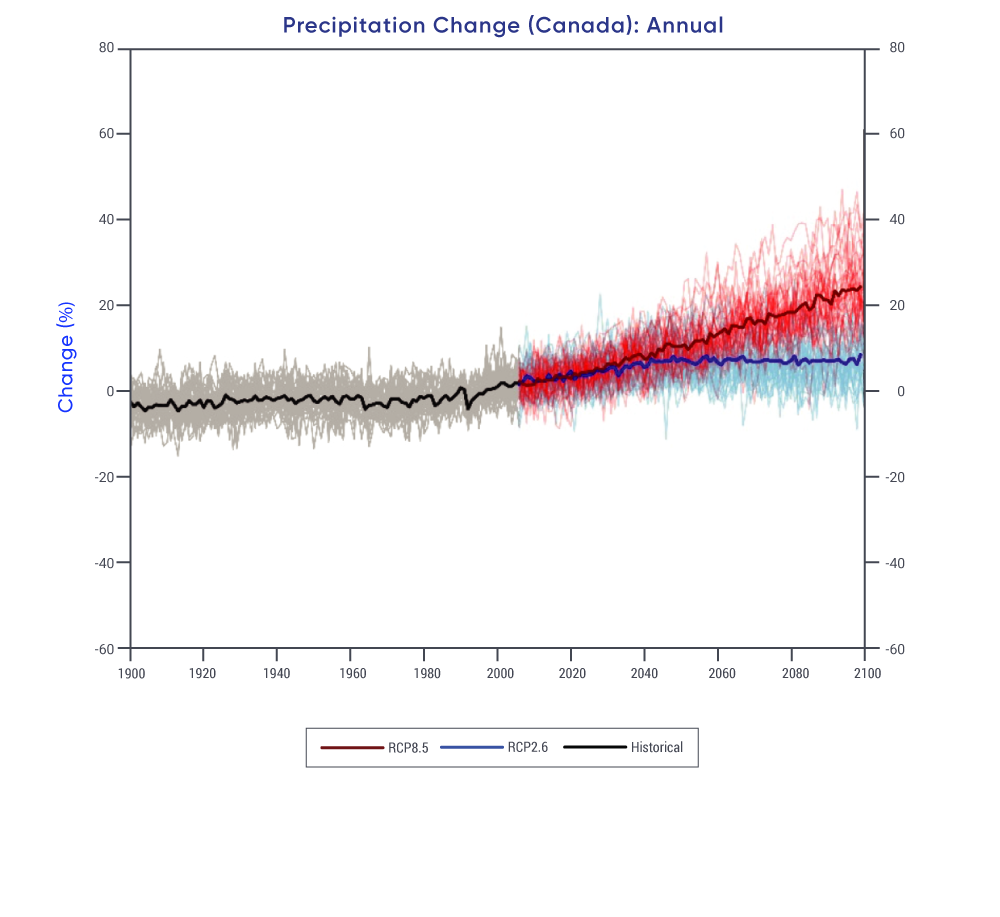
In the future, annual and winter precipitation is projected to increase in all regions, with larger relative changes for the North. Summer precipitation shows relatively smaller changes and is projected to decrease in southern regions of Canada by the end of the century under a high emission scenario. {4.3}

Figure ES4

Projected annual mean precipitation change (%) this century for Canada under a low emission scenario (RCP2.6) and a high emission scenario (RCP8.5). Projections are based on the Coupled Model Intercomparison Project (CMIP5) multi-model ensemble. Changes are relative to the 1986–2005 period. The thin lines show results from individual models and the heavy line is the […]

Figure ES4

Projected annual mean precipitation change (%) this century for Canada under a low emission scenario (RCP2.6) and a high emission scenario (RCP8.5). Projections are based on the Coupled Model Intercomparison Project (CMIP5) multi-model ensemble. Changes are relative to the 1986–2005 period. The thin lines show results from individual models and the heavy line is the multi-model mean. From Chapter 4 Figure 4.19.


Changes in climate extremes

Temperature extremes have changed in Canada, consistent with the increase in mean temperature. Extreme warm temperatures have become hotter, while extreme cold temperatures have become less cold. {4.2}

Most of the observed increase in (warming of) the coldest and warmest daily temperatures in Canada (1948–2012) can be attributed to human influence. Warming has also led to an increased risk of extreme fire weather in parts of western Canada. {4.2, 4.3}

In the future, a warmer climate will intensify some weather extremes. Extreme hot temperatures will become more frequent and more intense. This will increase the severity of heatwaves, and contribute to increased drought and wildfire risks. While inland flooding results from multiple factors, more intense rainfalls will increase urban flood risks. It is uncertain how warmer temperatures and smaller snowpacks will combine to affect the frequency and magnitude of snowmelt-related flooding. {4.2, 4.3, 4.4, 5.2, 6.2}

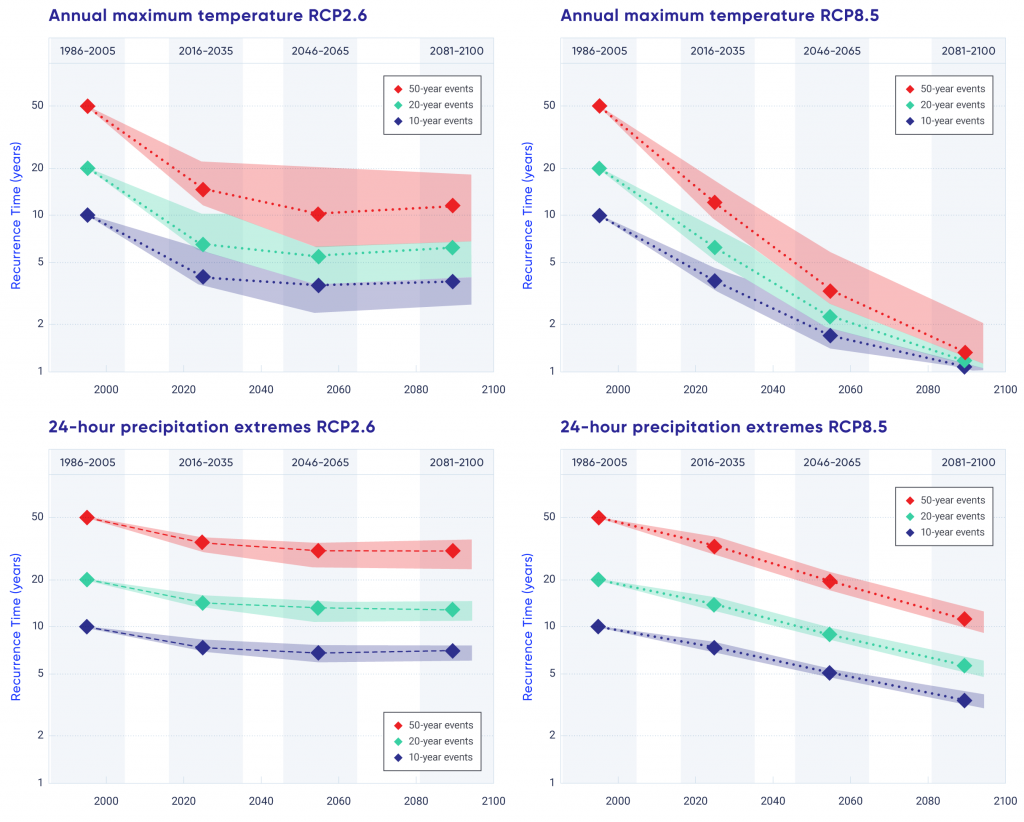
Changes in hot and cold extremes are projected to continue in the future, with the magnitude of the change proportional to the magnitude of the mean temperature change. For example, the annual highest daily temperature that currently occurs once every 20 years, on average, will become a once in 5-year event by mid-century under a low emission scenario (a four-fold increase in frequency) and a once in 2-year event by mid-century under a high emission scenario (a ten-fold increase in frequency). In the future, higher temperatures will contribute to an increased risk of extreme fire weather across much of Canada. {4.2, 4.3}

Extreme precipitation amounts accumulated over a day or shorter are projected to increase; thus, there is potential for a higher incidence of rain-generated local flooding, including in urban areas. {4.3, 6.2}

Future droughts and soil moisture deficits are projected with medium confidence to be more frequent and intense across the southern Canadian Prairies and interior British Columbia during summer at the end of the century under a high emission scenario. {6.4}
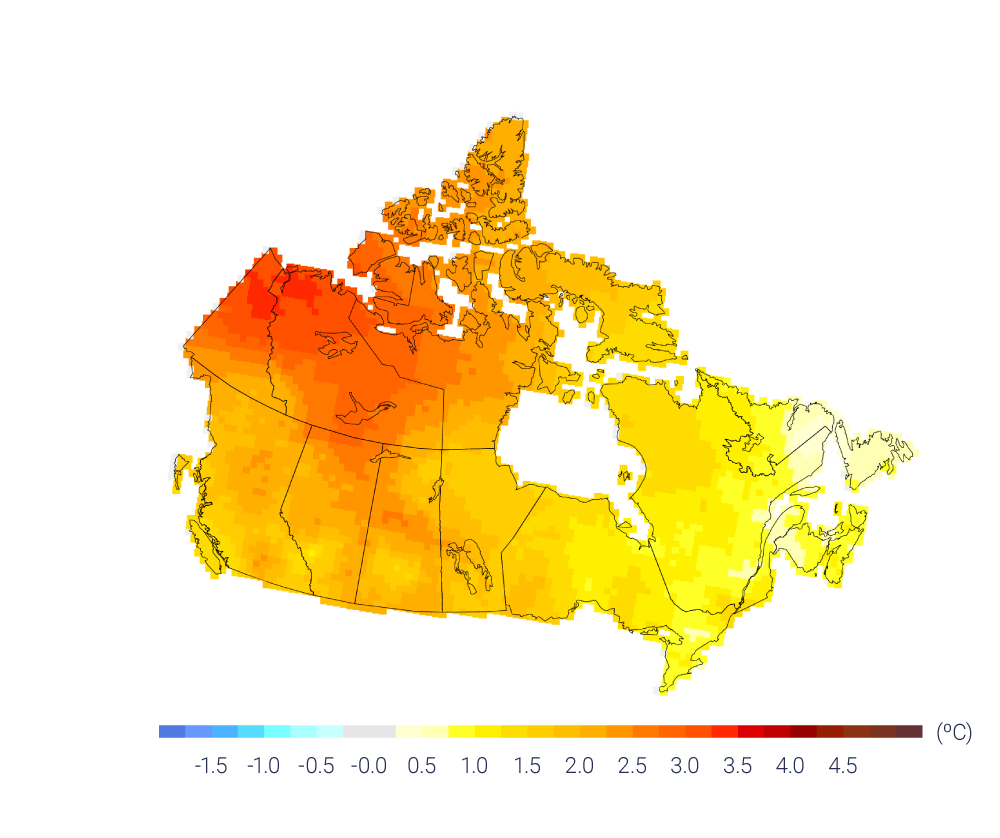
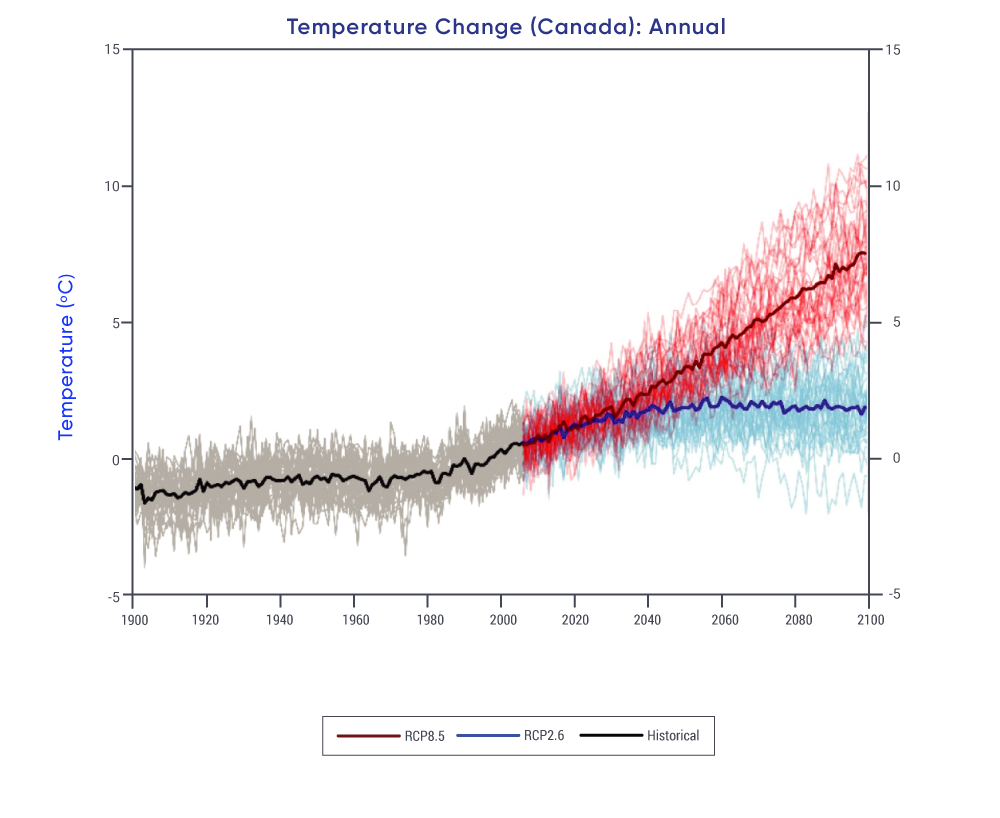
Figure ES5

Top panels: Projected changes in recurrence time (in years) for annual highest temperatures that occurred, on average, once in 10, 20, and 50 years in the late 20th century across Canada, as simulated by the Coupled Model Intercomparison Project (CMIP5) multi-model ensemble under a low emission scenario (RCP2.6) and a high emission scenario (RCP8.5). Lower […]

Figure ES5

Top panels: Projected changes in recurrence time (in years) for annual highest temperatures that occurred, on average, once in 10, 20, and 50 years in the late 20th century across Canada, as simulated by the Coupled Model Intercomparison Project (CMIP5) multi-model ensemble under a low emission scenario (RCP2.6) and a high emission scenario (RCP8.5). Lower panels: Projected changes in recurrence time for annual maximum 24-hour precipitation. From Chapter 4 Figures 4.12 and 4.20.


Changes in snow and ice

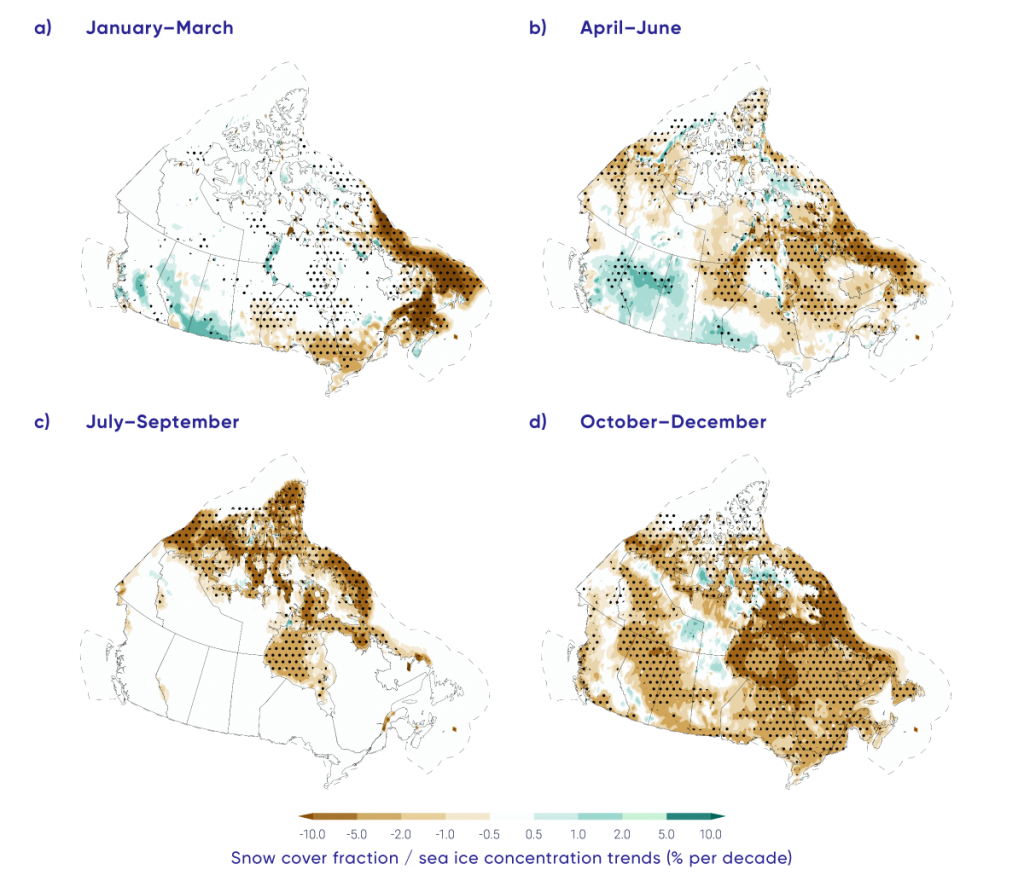
Over the past three decades, the proportion of Canadian land and marine areas covered by snow and ice have decreased and permafrost temperatures have risen. These changes are consistent with those observed in other northern regions of the world. {5.2, 5.3, 5.4, 5.5, 5.6}

Observed changes in snow and ice features across Canada present a coherent picture of a warming climate: fall and spring snow cover, the duration of seasonal lake ice cover across the Arctic, and summer sea ice extent have decreased; glaciers have thinned; and permafrost has warmed. These changes in the cryosphere in recent decades are in large part a response to increasing surface temperatures. Because some further warming is unavoidable, these trends will continue. {5.2, 5.3, 5.4, 5.5, 5.6}

Figure ES6

Terrestrial snow cover fraction and sea ice concentration seasonal trends for 1981–2015. Snow cover fraction is the proportion of time the ground is covered by snow. A decline of 10% per decade indicates a decline of approximately 3 days per month per decade in snow cover. Sea ice concentration is the percentage of area that […]

Figure ES6

Terrestrial snow cover fraction and sea ice concentration seasonal trends for 1981–2015. Snow cover fraction is the proportion of time the ground is covered by snow. A decline of 10% per decade indicates a decline of approximately 3 days per month per decade in snow cover. Sea ice concentration is the percentage of area that is covered with sea ice. Stippling indicates statistical significance. Dashed line denotes limit of Canadian marine territory. From Chapter 5 Figure 5.2.

Snow cover duration will decline to mid-century across Canada due to increases in temperature under all emission scenarios. Projections with a high emission scenario show continued snow loss after mid-century. Significant reductions in seasonal snow accumulation (the maximum snow water equivalent) are projected through to mid-century for much of southern Canada due to warming surface temperatures, while only small changes are projected for northern Canada because winter temperatures will remain sufficiently cold despite overall warming. {5.2}

Under a medium emission scenario, it is projected that glaciers across the mountains of western Canada will lose 74% to 96% of their volume by late century. Most small ice caps and ice shelves in the Canadian Arctic will disappear by 2100. Increases in mean air temperature over land underlain with permafrost are projected under all emissions scenarios, resulting in continued permafrost warming and thawing over large areas by mid-century with impacts on northern infrastructure and the carbon cycle. {5.4, 5.6}

Spring lake-ice break-up will be 10 to 25 days earlier by mid-century, and fall freeze-up 5 to 15 days later, depending on the emission scenario and lake specific characteristics (medium confidence). {5.5}

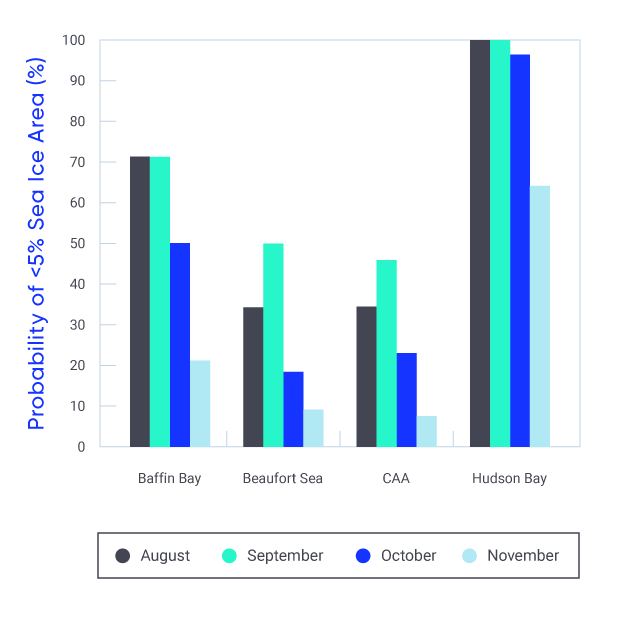
Canadian areas of the Arctic and Atlantic Oceans have experienced longer and more widespread sea ice-free conditions. Canadian Arctic marine areas, including the Beaufort Sea and Baffin Bay, are projected to have extensive ice-free periods during summer by mid-century. The last area in the entire Arctic with summer sea ice is projected to be north of the Canadian Arctic Archipelago (CAA) (and including the northern islands of the CAA). This area will be an important refuge for ice-dependent species and an ongoing source of ice, which will drift into navigation routes in Canadian waters. {5.3}

Figure ES7

Probability of sea ice–free conditions in Canadian Arctic marine areas by 2050 under a high emission scenario (RCP8.5) from the Coupled Model Intercomparison Project (CMIP5) multi-model mean. 5% sea ice area was used to define ice-free conditions. From Chapter 5 Figure 5.11.

Figure ES7

Probability of sea ice–free conditions in Canadian Arctic marine areas by 2050 under a high emission scenario (RCP8.5) from the Coupled Model Intercomparison Project (CMIP5) multi-model mean. 5% sea ice area was used to define ice-free conditions. From Chapter 5 Figure 5.11.


Changes in freshwater availability

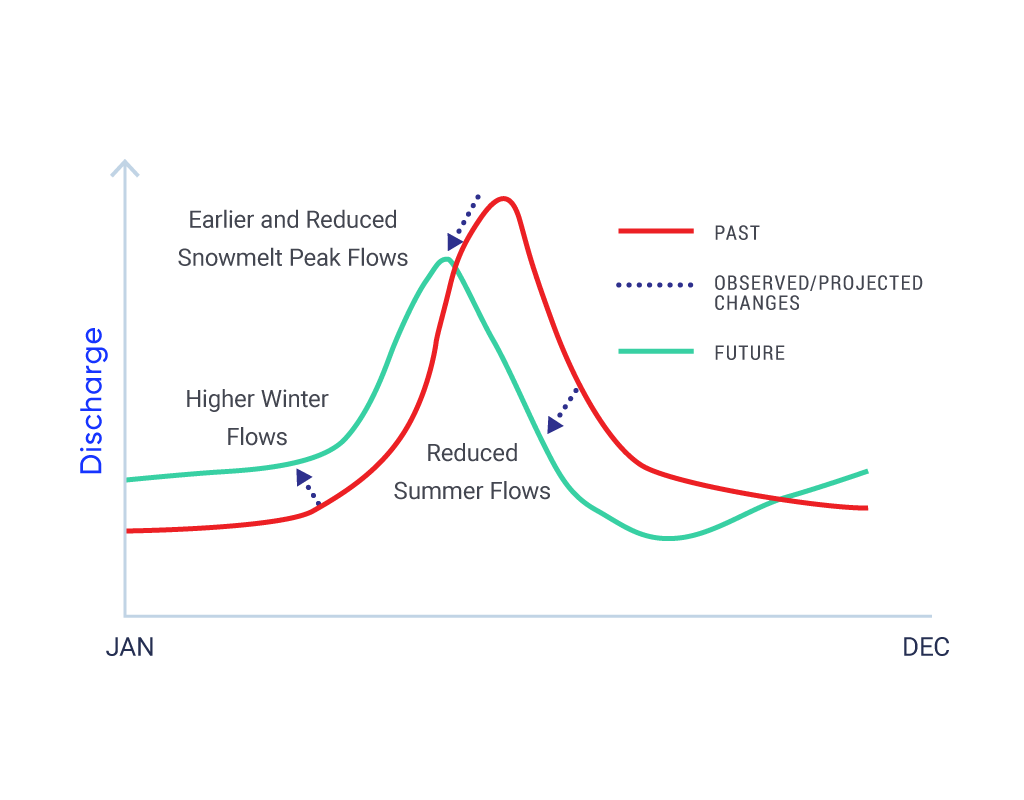
The seasonal availability of freshwater is changing, with an increased risk of water supply shortages in summer. Warmer winters and earlier snowmelt will combine to produce higher winter flows in streams and rivers, while smaller snowpacks and loss of glacier ice this century will combine to produce lower summer flows. Warmer summers will increase evaporation of surface water and contribute to reduced summer water availability in the future despite more precipitation in some places. {4.2, 4.3, 5.2, 5.4, 6.2, 6.3, 6.4}

The most significant observed changes in freshwater availability are in the seasonal distribution of streamflow in many snow-fed river basins: winter flows have become higher, the timing of spring peak flows has become earlier, and there has been an overall reduction in summer flows. However, many other indicators — annual streamflow magnitudes, surface and shallow groundwater water levels, soil moisture content and droughts — have, for the most part, been variable, with no clear increasing or decreasing trends. {6.2, 6.3, 6.4, 6.5}

In association with warmer temperatures, seasonal changes in streamflow are expected to continue, including shifts from more snowmelt-dominated flow patterns toward rainfall-dominated flow patterns. Shifts toward earlier snowmelt-related floods, including those associated with spring snowmelt, ice jams, and rain falling on snow, are also anticipated. {6.2}

Figure ES8

Schematic diagram showing past and future projected changes in the seasonal distribution of streamflow in many snow-fed river basins across Canada. In association with warming temperatures, spring peak streamflow following snowmelt has, and will continue to, occur earlier with higher winter flows and reduced summer flows.


Ocean changes

Oceans surrounding Canada have warmed, become more acidic, and less oxygenated, consistent with observed global ocean changes over the past century. Ocean warming and loss of oxygen will intensify with further emissions of all greenhouse gases, whereas ocean acidification will increase in response to additional carbon dioxide emissions. These changes threaten the health of marine ecosystems. {2.2, 7.2, 7.6}

Oceans surrounding Canada are projected to continue to warm over the 21st century, in response to past and future emissions of greenhouse gases, with the size of the increase depending on the emission scenario. There is medium confidence that the warming in summer will be greatest in the ice-free areas of the Arctic and off southern Atlantic Canada, and the warming in winter will be greatest off Atlantic Canada. {7.2}

With the exception of waters south of Atlantic Canada, the ocean surface is projected to become less salty in Canadian waters over the rest of this century due to increases in precipitation and melting of land and sea ice. The freshening in the upper layers of the ocean, along with warming, will affect the ocean’s ability to sequester greenhouse gases, dissolved oxygen levels, and marine ecosystems. {7.3}

Increasing acidity (decreasing pH) of the upper-ocean waters surrounding Canada has been observed, consistent with increased carbon dioxide uptake from the atmosphere. This trend is expected to continue, with acidification occurring most rapidly in the Arctic Ocean. {7.6}


Sea level change

Coastal flooding is expected to increase in many areas of Canada due to local sea-level rise. Changes in local sea level are a combination of global sea-level rise and local land subsidence or uplift. {7.5}

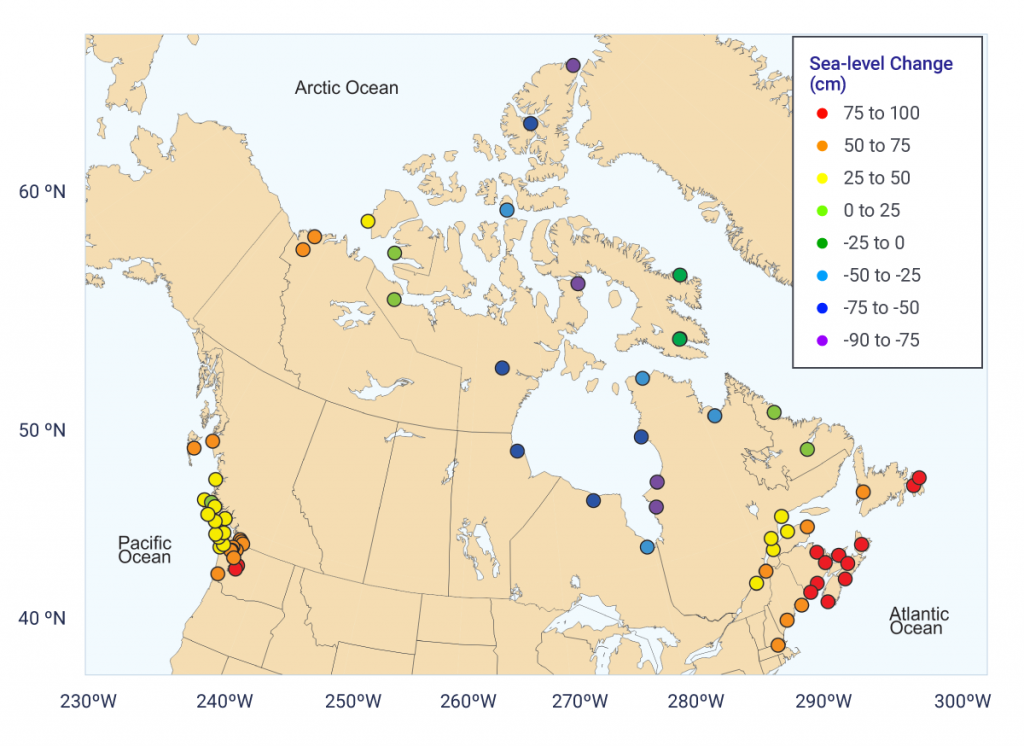
Globally, sea level has risen and is projected to continue to rise. Local sea level is projected to rise along most of the Atlantic and Pacific coasts of Canada and the Beaufort coast in the Arctic where the land is subsiding or slowly uplifting. Where the land is uplifting fastest (e.g., in Hudson Bay), local sea level is projected to fall. In those areas where local sea level is projected to rise, the frequency and magnitude of extreme high water-level events will increase. The loss of sea ice in Arctic and Atlantic Canada further increases the risk of damage to coastal infrastructure and ecosystem as a result of larger storm surges and waves. {7.5}

Figure ES9

Projected relative (local) sea-level change along Canadian coastlines at the end of the century. Changes in local sea level are a combination of global sea level rise and local land subsidence or uplift. Projections shown are the median projection based on a high emission scenario (RCP8.5) and are relative to the average conditions in the […]

Figure ES9

Projected relative (local) sea-level change along Canadian coastlines at the end of the century. Changes in local sea level are a combination of global sea level rise and local land subsidence or uplift. Projections shown are the median projection based on a high emission scenario (RCP8.5) and are relative to the average conditions in the 1986–2005 period. From Chapter 7 Figure 7.16.


Our future: choices matter

The effects of widespread warming are evident in many parts of Canada and are projected to intensify in the future. The rate and magnitude of climate change under high versus low emission scenarios project two very different futures for Canada. Scenarios with large and rapid warming illustrate the profound effects on Canadian climate of continued growth in greenhouse gas emissions. Scenarios with limited warming will only occur if Canada and the rest of the world reduce carbon emissions to near zero early in the second half of the century and reduce emissions of other greenhouse gases substantially. {3.3, 4.2}

Beyond the next few decades, the largest uncertainty about the magnitude of future climate change is rooted in uncertainty about human behaviour, that is, whether the world will follow a pathway of low, medium, or high emissions. Given this uncertainty, projections based on a range of emission scenarios are needed to inform impact assessment, climate risk management, and policy development. {3.3, 4.2}.

Figure ES10

Projected annual temperature change for Canada under a low emission scenario (RCP2.6) (left panel) and a high emission scenario (RCP8.5) (right panel) for the late century. Projections are based on the Coupled Model Intercomparison Project (CMIP5) multi-model ensemble. Changes are relative to the 1986–2005 period. From Chapter 4 Figure 4.8.

Footnotes

  1. Except where noted otherwise, assessment conclusions in this Executive Summary have a confidence level of at least high confidence. Calibrated uncertainty language used in this report is explained in Section 1.4.1.
  2. Values provided are the median projection based on multiple climate models. Corresponding uncertainty ranges are provided in Chapter 4, Section 4.2.  
Next

About This Report