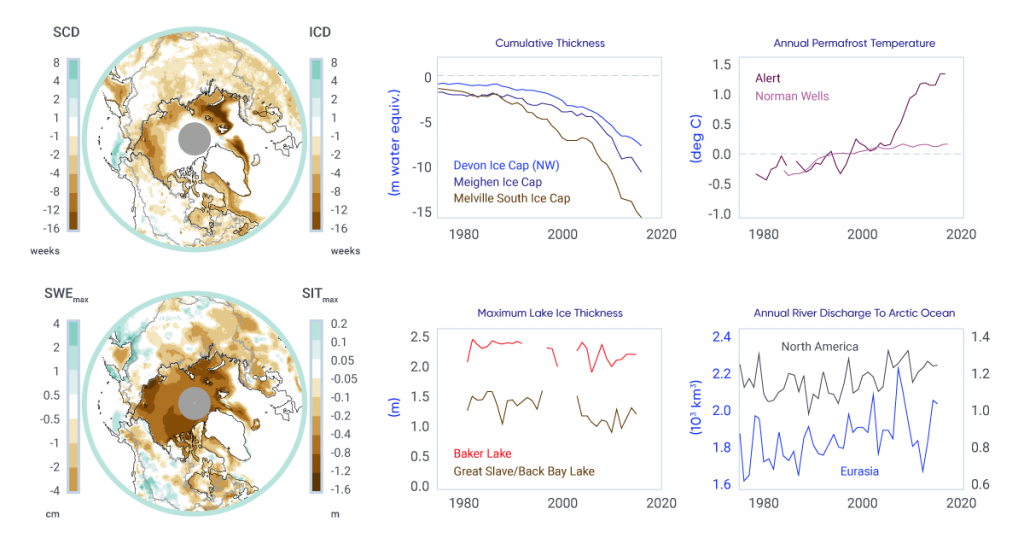
Figure-5.1: Indicators of changes in the cryosphere as a result of warming


Left: Difference in snow cover duration (SCD) and sea ice cover duration (ICD; upper), and in seasonal maximum snow water equivalent (SWEmax) and sea ice thickness (SITmax; lower) between the periods 2006–2015 and 1981–1990. Right: Time series of cumulative specific volume change (the running total of ice cap surface mass balance divided by ice cap area) for three ice caps in the Canadian Arctic; annual mean ground temperature departure in the sub-Arctic Mackenzie Valley (Norman Wells) and high Arctic (Alert) relative to the 1988–2007 mean; annual maximum lake ice thickness (Great Slave Lake, Northwest Territories and Baker Lake, Nunavut); and annual river discharge summed for rivers draining into the Arctic Ocean from North America and Eurasia.
SCD and SWE from a blend of five snow products; ICD from satellite passive microwave data; and SIT from the PIOMAS Arctic Sea Ice Volume Reanalysis. Ice cap volume data from David Burgess, Natural Resources Canada; ground temperature data from Sharon Smith, Natural Resources Canada; lake ice thickness data from Claude Duguay, University of Waterloo; Arctic river discharge data from Stephen Dery, University of Northern British Columbia.