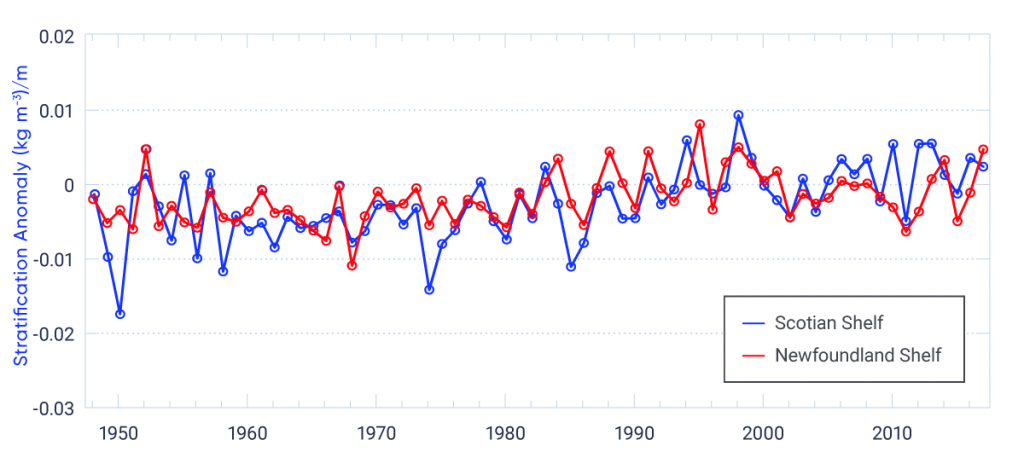
Interactive Figure 7.11: Ocean stratification changes on the Scotian Shelf and Newfoundland Shelf


Stratification index (density difference from the ocean surface [0 m] to the depth of 50 m) is expressed as a mean annual anomaly (departure from normal) for the period 1948–2017. The time series for the Scotian Shelf is derived from data collected from several areas across the shelf, which are combined to provide one annual anomaly estimate. The time series for the Newfoundland Shelf is based on data collected at the AZMP Station 27. The long-term trend is significantly positive for both the Scotian Shelf (1948–2017, positive trend 0.0015 (kg/m3) per decade, significant at 1% level) and the Newfoundland Shelf (1948–2017, positive trend 0.00074 (kg/m3) per decade, significant at 1% level).
Data from DFO monitoring programs (Hebert et al., 2016; Colbourne et al., 2017).