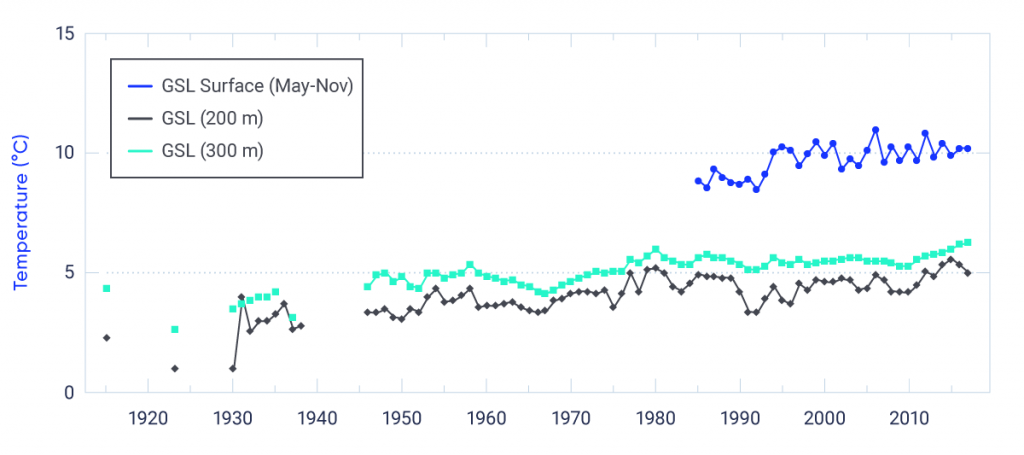
Interactive Figure 7.5: Ocean temperature in the Gulf of St. Lawrence


Ocean temperature time series for the surface and at depths of 200 and 300 m in the Gulf of St. Lawrence collected by DFO monitoring programs. Sea surface temperature (May to November average, ice-free period) from advanced very-high-resolution radiometer satellite observations (1985–2017, positive trend of 0.46°C per decade, significant at 1% level). Temperature from in situ observations at depths of 200 m (1915–2017, positive trend of 0.25°C per decade, significant at 1% level) and 300 m (1915–2017, positive trend of 0.23°C per decade, significant at 1% level) indicate warming in the deep Gulf of St. Lawrence over the past half-century.
Data from DFO monitoring programs (Galbraith et al., 2012; Galbraith et al., 2017). Atlantic Zone Monitoring Program <http://www.meds-sdmm.dfo-mpo.gc.ca/isdm-gdsi/azmp-pmza/index-eng.html>