Chapter 7

Changes in Oceans Surrounding Canada

This chapter describes physical and chemical changes in the oceans surrounding Canada on decadal and longer timescales, and discusses these changes in the context of anthropogenic climate change and natural climate variability.

Recommended citation

Greenan, B.J.W., James, T.S., Loder, J.W., Pepin, P., Azetsu-Scott, K., Ianson, D., Hamme, R.C., Gilbert, D., Tremblay, J-E., Wang, X.L. and Perrie, W. (2019): Changes in oceans surrounding Canada; Chapter 7 in (eds.) Bush and Lemmen, Canada’s Changing Climate Report; Government of Canada, Ottawa, Ontario, p. 343-423.

Authors

  • Blair J. W. Greenan (Fisheries and Oceans Canada)
  • Thomas S. James (Natural Resources Canada)
  • John W. Loder (Fisheries and Oceans Canada)
  • Pierre Pepin (Fisheries and Oceans Canada)
  • Kumiko Azetsu-Scott (Fisheries and Oceans Canada)
  • Debby Ianson (Fisheries and Oceans Canada)
  • Roberta C. Hamme (University of Victoria)
  • Denis Gilbert (Fisheries and Oceans Canada)
  • Jean-Éric Tremblay (Université Laval)
  • Xiaolan L. Wang (Environment and Climate Change Canada)
  • Will Perrie (Fisheries and Oceans Canada)
Figure-7.1
View details
Figure-7.2
View details
Figure-7.3
View details
Figure-7.4
View details
Figure-7.5
View details
Figure-7.6
View details
Figure-7.7
View details
Figure-7.8
View details
Figure-7.9
View details
Figure-7.10
View details
Figure-7.11
View details
Figure-7.12
View details
Figure-7.13
View details
Figure-7.14
View details
Figure-7.15
View details
Figure-7.16
View details
Figure-7.17
View details
Box 7.5, Photos 1
View details
Figure-7.18
View details
Figure-7.19
View details
Figure-7.20
View details
Figure-7.21
View details
Figure-7.22
View details
Figure-7.23
View details

Chapter Key Messages

Ocean Temperature

Upper-ocean temperature has increased in the Northeast Pacific and most areas of the Northwest Atlantic over the last century, consistent with anthropogenic climate change (high confidence). The upper ocean has warmed in the Canadian Arctic in summer and fall as a result of increases in air temperature and declines in sea ice (medium confidence).

Oceans surrounding Canada are projected to continue to warm over the 21st century in response to past and future emissions of greenhouse gases. The warming in summer will be greatest in the ice-free areas of the Arctic and off southern Atlantic Canada, where subtropical water is projected to shift further north (medium confidence). During winter in the next few decades, the upper ocean surrounding Atlantic Canada will warm the most, the Northeast Pacific will experience intermediate warming rates, and the Arctic and eastern sub-Arctic ocean areas (including Hudson Bay and Labrador Sea) will warm the least (medium confidence).

Ocean Salinity and Density Stratification

There has been a slight long-term freshening of upper-ocean waters in most areas off Canada as a result of various factors related to anthropogenic climate change, in addition to natural decadal-scale variability (medium confidence). Salinity has increased below the surface in some mid-latitude areas, indicating a northward shift of saltier subtropical water (medium confidence).

Freshening of the ocean surface is projected to continue in most areas off Canada over the rest of this century under a range of emission scenarios, due to increases in precipitation and melting of land and sea ice (medium confidence). However, increases in salinity are expected in off-shelf waters south of Atlantic Canada due to the northward shift of subtropical water (medium confidence). The upper-ocean freshening and warming is expected to increase the vertical stratification of water density, which will affect ocean sequestration of greenhouse gases, dissolved oxygen levels, and marine ecosystems.

Marine Winds, Storms, and Waves

Surface wave heights and the duration of the wave season in the Canadian Arctic have increased since 1970 and are projected to continue to increase over this century as sea ice declines (high confidence). Off Canada’s east coast, areas that currently have seasonal sea ice are also anticipated to experience increased wave activity in the future, as seasonal ice duration decreases (medium confidence).

A slight northward shift of storm tracks, with decreased wind speed and lower wave heights off Atlantic Canada, has been observed and is projected to continue in future (low confidence). Off the Pacific coast of Canada, wave heights have been observed to increase in winter and decrease in summer, and these trends are projected to continue in future (low confidence).

Sea Level

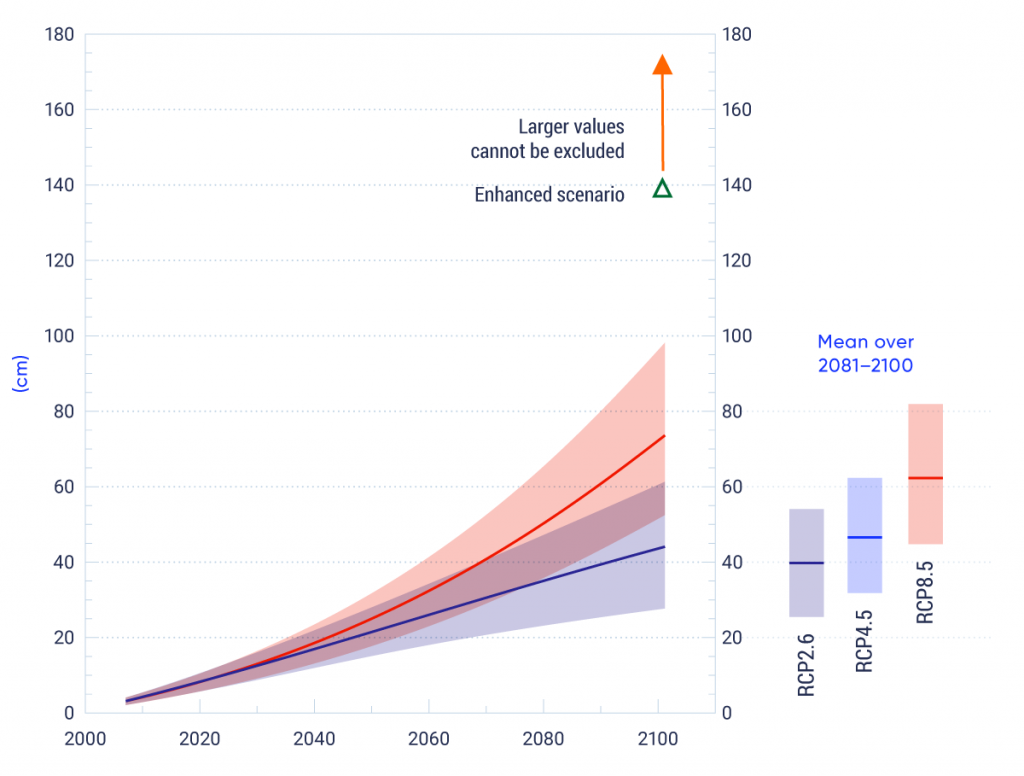
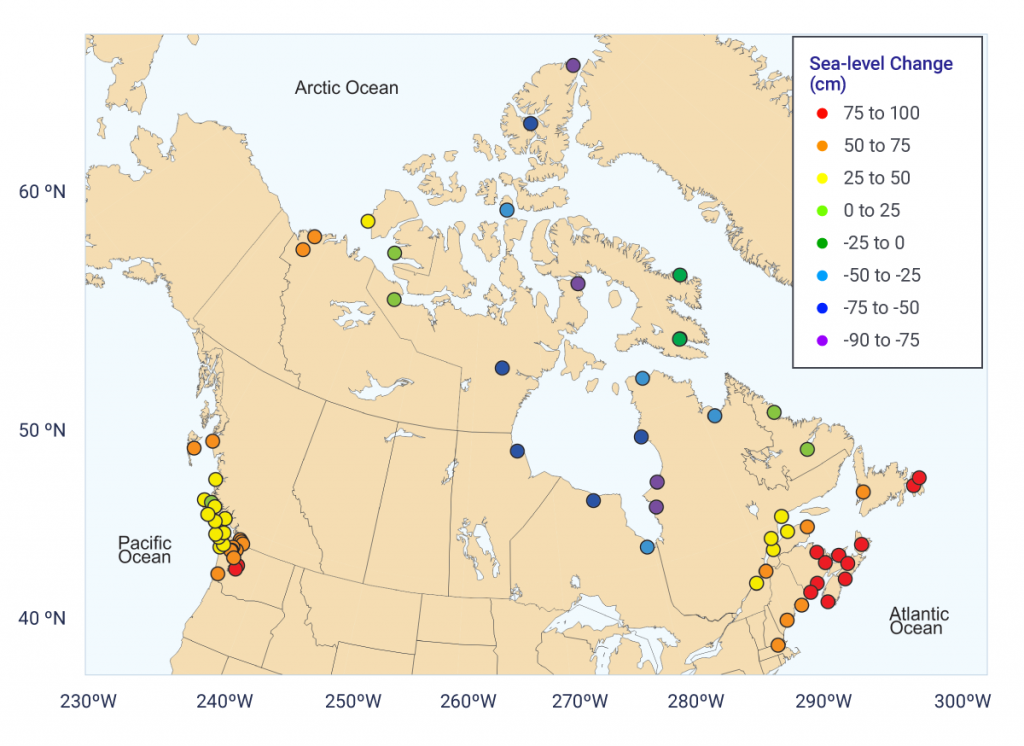
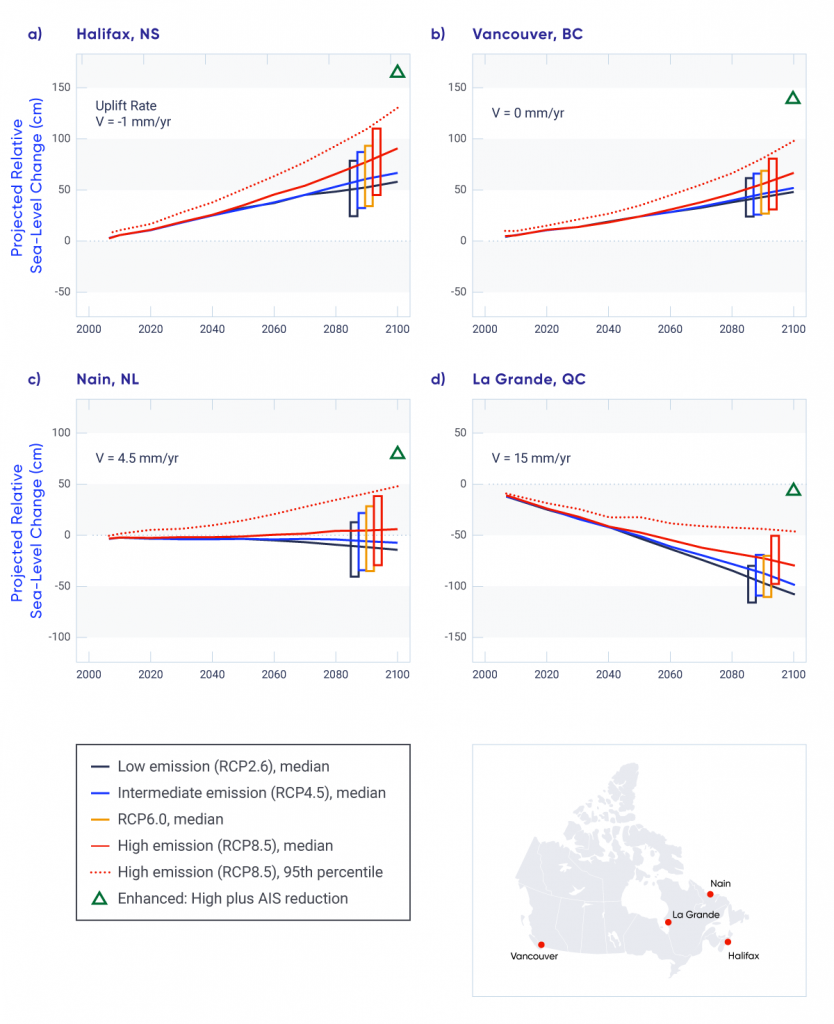
Globally, sea level has risen, and is projected to continue to rise. The projected amount of global sea-level rise in the 21st century is many tens of centimetres and it may exceed one metre. However, relative sea level in different parts of Canada is projected to rise or fall, depending on local vertical land motion. Due to land subsidence, parts of Atlantic Canada are projected to experience relative sea-level change higher than the global average during the coming century (high confidence).

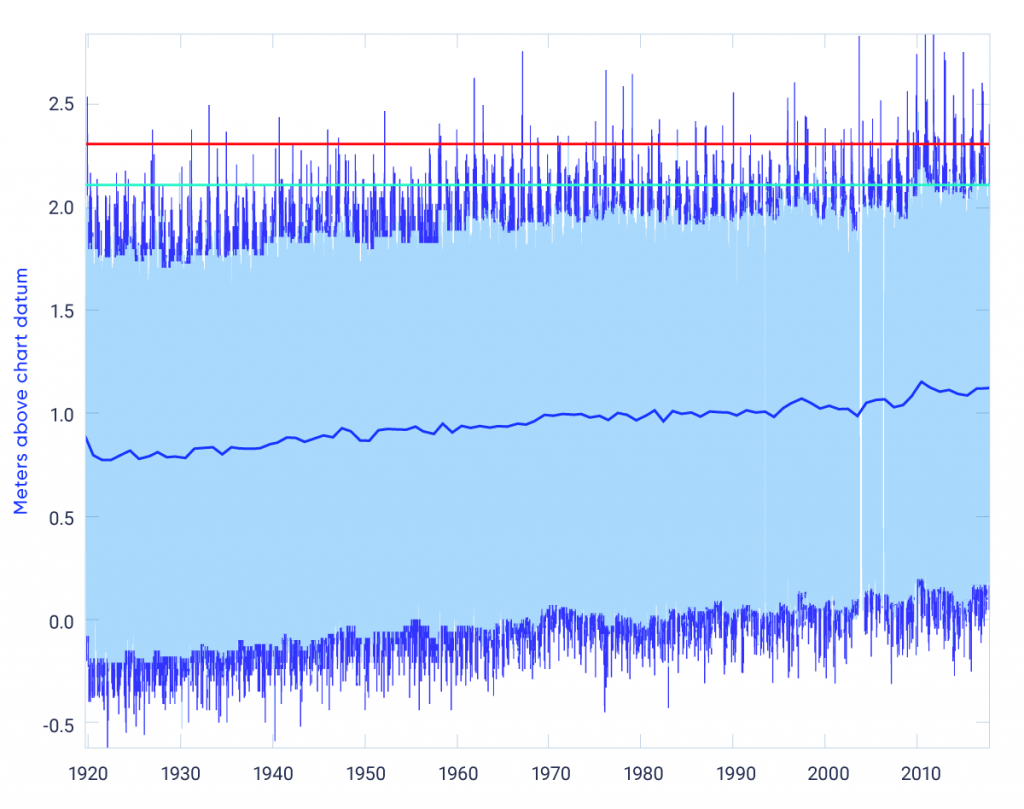
 Where relative sea level is projected to rise (most of the Atlantic and Pacific coasts and the Beaufort coast in the Arctic), the frequency and magnitude of extreme high water-level events will increase (high confidence). This will result in increased flooding, which is expected to lead to infrastructure and ecosystem damage as well as coastline erosion, putting communities at risk. Adaptation actions need to be tailored to local projections of relative sea-level change.

Extreme high water-level events are expected to become larger and occur more often in areas where, and in seasons when, there is increased open water along Canada’s Arctic and Atlantic coasts, as a result of declining sea ice cover, leading to increased wave action and larger storm surges (high confidence).

Ocean Chemistry

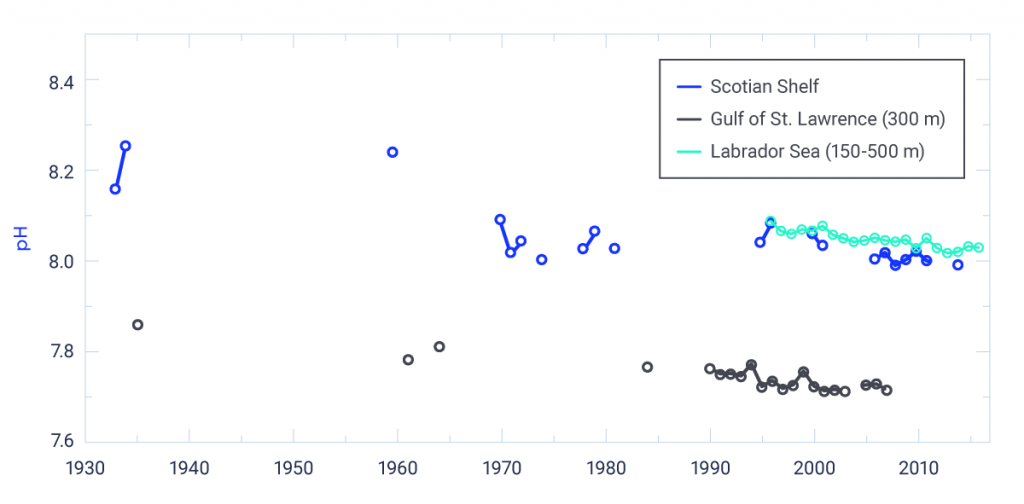
Increasing acidity (decreasing pH) of the upper-ocean waters surrounding Canada has been observed, consistent with increased carbon dioxide uptake from the atmosphere (high confidence). This trend is expected to continue, with acidification occurring most rapidly in the Arctic Ocean (high confidence).

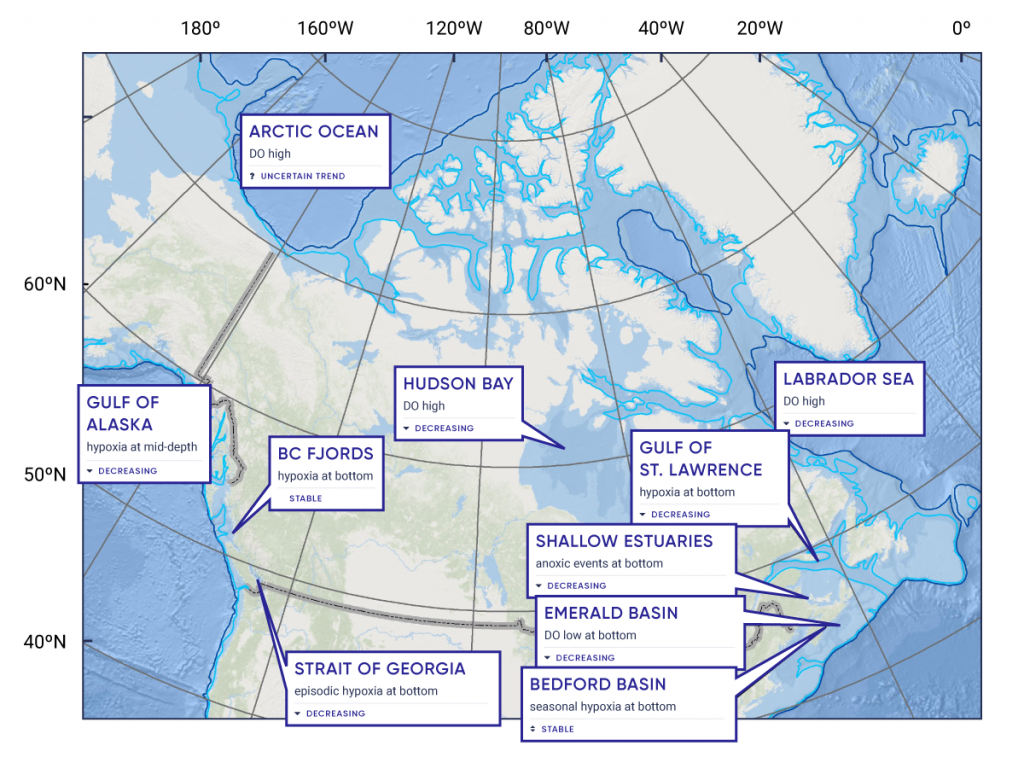
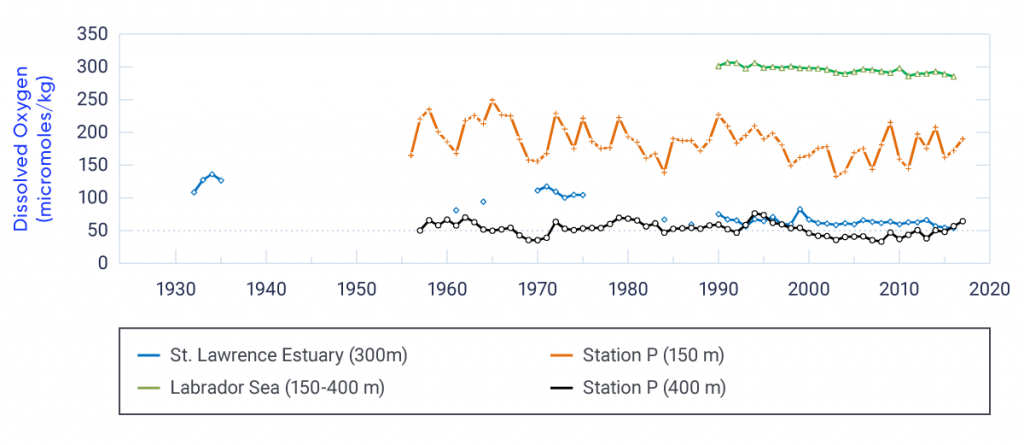
Subsurface oxygen concentrations have decreased in the Northeast Pacific and Northwest Atlantic oceans off Canada (high confidence). Increased upper-ocean temperature and density stratification associated with anthropogenic climate change have contributed to this decrease (medium confidence). Low subsurface oxygen conditions will become more widespread and detrimental to marine life in future, as a result of continuing climate change (medium confidence).

Nutrient supply to the ocean-surface layer has generally decreased in the North Pacific Ocean, consistent with increasing upper-ocean stratification (medium confidence). No consistent pattern of nutrient change has been observed for the Northwest Atlantic Ocean off Canada. There are no long-term nutrient data available for the Canadian Arctic.


Summary

The global ocean covers approximately 71% of the Earth’s surface and is a vast reservoir of water, energy, carbon, and many other substances. It is a key component of the climate system and interacts directly with the atmosphere and cryosphere. Freshwater resources are also linked to the ocean via runoff in coastal areas. The ocean plays an important role in mitigating anthropogenic climate change through its ability to absorb substantial amounts of heat and carbon.

Canada is surrounded by oceans on three sides — the Pacific, Arctic, and Atlantic oceans. There is strong evidence of human-induced changes during the past century in key ocean-climate properties — such as temperature, sea ice, sea level, acidity, and dissolved oxygen — off Canada. Warmer ocean temperature has contributed to declining sea ice and increasing sea level. However, there is an area south of Greenland where there has been little ocean warming, so regional trends do differ. Warming and a slight freshening of the upper ocean have reduced its density resulting in increased vertical differences in density (referred to as “density stratification”) in oceans off Canada; this could affect the vertical transport of heat, carbon, and nutrients and, thereby, ecosystem health and services.

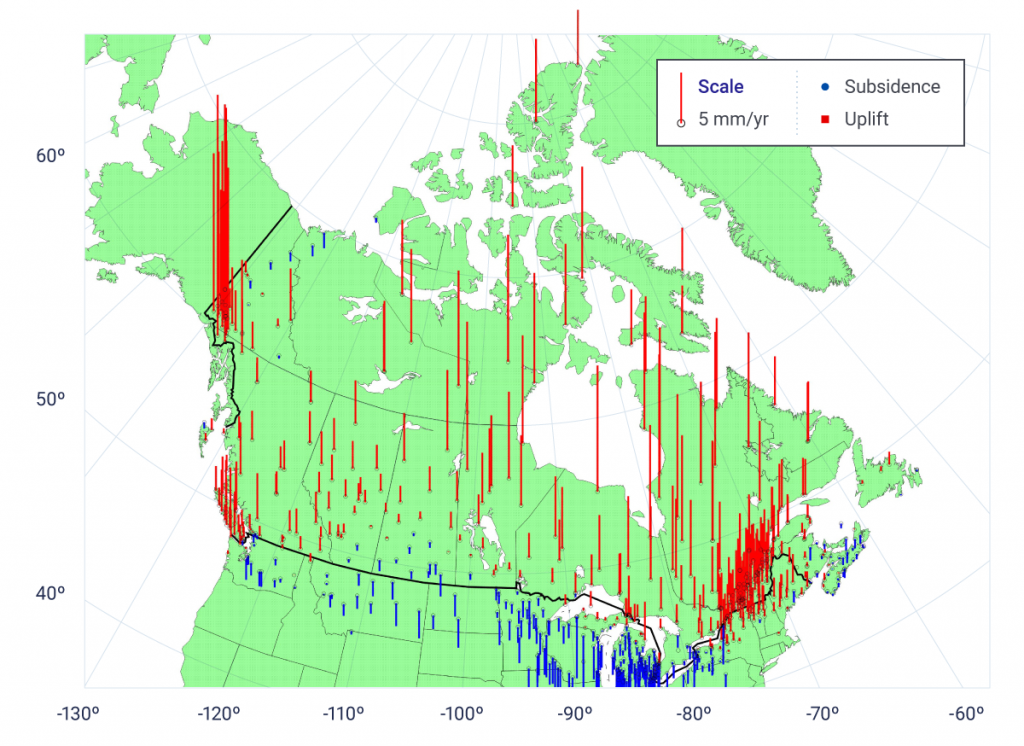
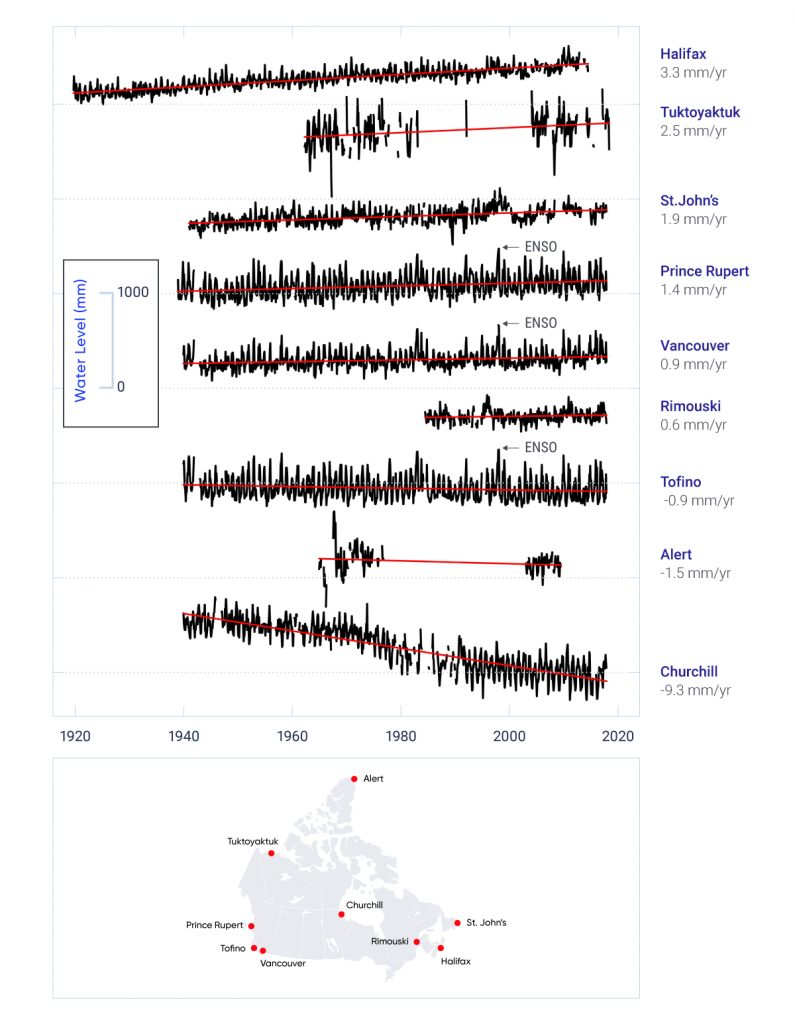
Global sea levels are rising due to ocean thermal expansion, and diminishing glaciers and ice sheets which deliver water to the oceans. Changes in sea level relative to Canada’s coastline are also affected by vertical land motion (upward, called “uplift” or downward, called “subsidence”) in response to the retreat of the last glacial ice sheet. Relative sea level has increased in most regions of Canada over the last century and even exceeded the global rate of change in southern Atlantic Canada, where land is subsiding. However, there are regions of Canada (e.g., Hudson Bay) where relative sea level has fallen as a result of the rate of uplift being higher than the rate of global sea-level rise. Increasing relative sea level is also increasing risks for coastal infrastructure and communities. This is compounded by increases in ocean wave heights in areas that have experienced seasonal reductions in sea ice.

Ocean chemistry has undergone changes, such as increasing acidity and decreasing subsurface oxygen concentrations, as a result of anthropogenic climate change. The physical and chemical trends observed in the oceans surrounding Canada are consistent with changes observed in the atmosphere, cryosphere, freshwater systems, and adjoining oceans.

The fundamental principles that govern how the physical and chemical environment of the ocean will respond to increased atmospheric carbon dioxide have allowed model-based projections of future conditions in the oceans surrounding Canada under a range of emission scenarios. In general, warming and freshening at the ocean surface is projected during this century, which will continue to increase stratification and reduce sea ice. Sea-level rise along some Canadian coastlines will be higher than the global average during this century, leading to increased flooding and erosion. Ocean acidification and decreasing subsurface oxygen levels will continue, with increasingly adverse implications for marine ecosystems.

7.1

Introduction

The global ocean — composed of an interconnected system of oceans — is an integral component of the climate system and is experiencing change in its physical, chemical, and biological properties. The ocean has absorbed more than 90% of the increase in heat energy in the climate system between 1971 and 2010 (Rhein et al., 2013124; Jewett and Romanou, 201780). This has led to in an increase in ocean heat content, which is a robust indicator of global warming (Cheng et al., 201714). The ocean also stores and distributes water from melting land glaciers and ice sheets, making it a very important reservoir in the global water cycle. Increased heat content, which causes water to expand and occupy more volume, and added meltwater from glaciers are the predominant sources of global sea-level rise, accounting for about three-quarters of the change between 1971 and 2010 (Church et al., 201318). The ocean has also absorbed more than one-quarter of all carbon dioxide (CO2) emissions to the atmosphere from human activity over the period of 1750 to 2011 (Rhein et al., 2013124), and this has increased the acidity of seawater (ocean acidification).

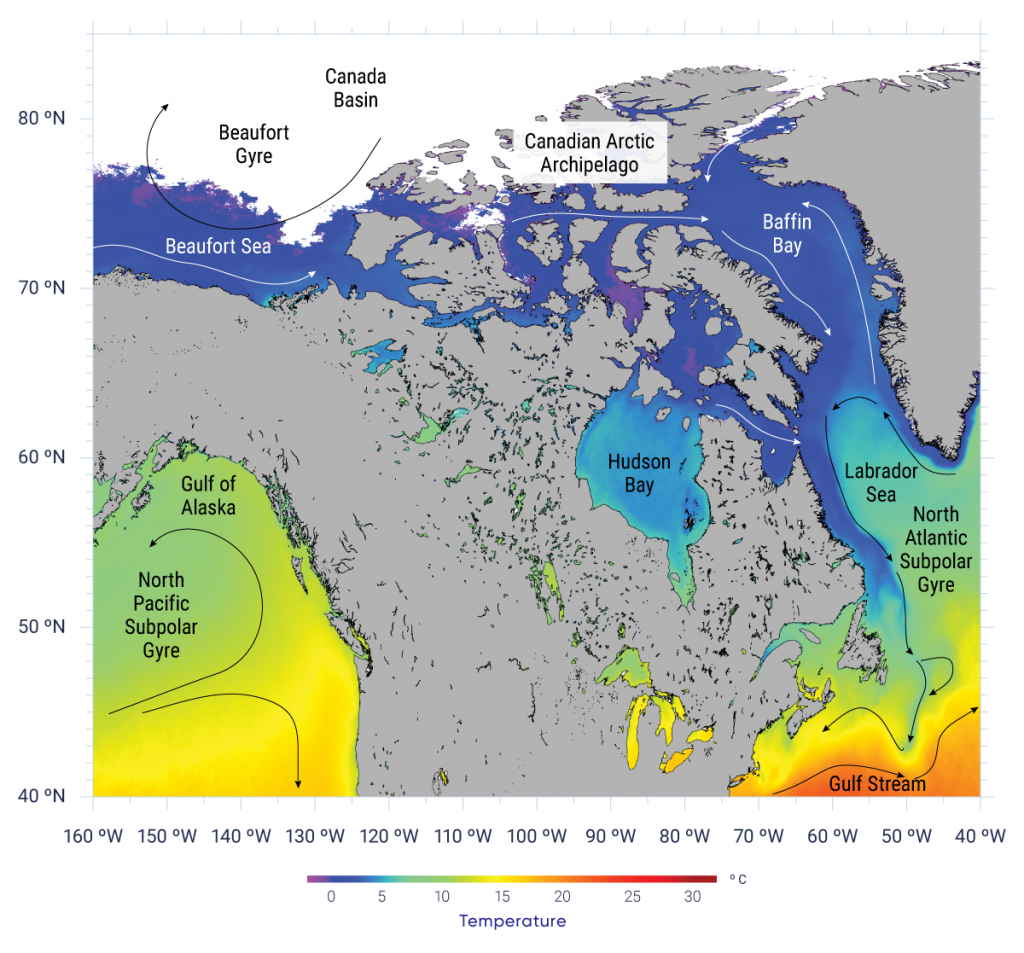
Canada’s coastline is vast, approximately 230,000 km in length, with over half bordering the Arctic Ocean (see Box 7.1). The oceans off Canada generally have a relatively narrow coastal zone, with embayments and shallow water; a plateau-like continental shelf with typical water depths of 100–300 m; and a continental slope with depths increasing to 3000–5000 m in the major ocean basins. There are large regional differences in ocean temperatures surrounding Canada (see Figure 7.1). The west coast is influenced by the eastward-flowing North Pacific Current, which supplies source water for both the North Pacific subpolar and subtropical gyres (see Box 7.2). The resulting northward-flowing Alaska Current and the southward-flowing California Current regions are both important upwelling zones, which bring nutrient-rich water to the surface and support diverse marine ecosystems. Pacific water is transported to the western Arctic through the Bering Strait between Alaska and Russia. Circulation in the Arctic Ocean is complex, but the primary feature of the western Arctic off Canada is the counterclockwise-flowing Beaufort Gyre, with eastward coastal flow. Some of the Pacific water that enters the Arctic flows out through the Canadian Arctic Archipelago to Baffin Bay and south to the Labrador Sea and beyond. The North Atlantic Ocean off Canada is influenced by the intense western boundary currents of its two basin-scale gyres — the subpolar gyre’s Labrador Current and the subtropical gyre’s Gulf Stream. As shown in Figure 7.1, the Labrador and Newfoundland Shelf and Slope regions and the Gulf of St. Lawrence are linked to outflow from the Arctic via the Labrador Current, but the Gulf of St. Lawrence is a nearly enclosed coastal sea that is also strongly influenced by freshwater runoff from the St. Lawrence River system. The Scotian Shelf, Gulf of Maine, southern Newfoundland Shelf, and their adjoining continental slope regions have strong spatial gradients (or differences) in temperature and salinity associated with the cold and fresh Labrador Current flowing southward along the shelf edge and the warm and saline Gulf Stream flowing northeastward further offshore.

Figure-7.1

Sea surface temperatures, currents, and gyres in the oceans surrounding Canada

Map displaying the fall (September–November) average sea surface temperature (1985–2013) in the oceans surrounding Canada, based on advanced very-high-resolution radiometer satellite infrared imagery. The map area displayed includes the Northwest Atlantic, Arctic, and Northeast Pacific Oceans. Strong differences in temperature are evident in the area off Atlantic Canada, where the cold subpolar waters on the continental shelves are close to warm subtropical waters. Cold waters (below 2°C) and sea ice predominate at latitudes above 70° north latitude. The figure also shows the general direction of upper-ocean currents and gyres influencing Canadian waters.
Figure-7.1

Fall (September–November) average sea surface temperature (1985–2013) in the oceans surrounding Canada, based on advanced very-high-resolution radiometer satellite infrared imagery. The lines (both black and white) with arrowheads represent the general direction of upper-ocean currents. Ice-covered marine areas are coloured white.

Source

Adapted from Larouche and Galbraith (2016).

The Labrador Sea between Atlantic Canada and Greenland plays a key role in the global climate system because it is one of the few regions in the global ocean where surface waters become dense enough, as a result of winter cooling, to sink to intermediate ocean depths of up to 2400 m, through a process called “deep convection.” This supplies a branch of the global ocean’s meridional overturning circulation (sometimes referred to as the “global conveyor belt”), a system of surface and deep currents that transports large amounts of water, heat, salt, carbon, nutrients, and other substances around the globe. Under anthropogenic climate change, surface warming and freshening, and the associated increase in upper-ocean stratification (see Box 7.4) are expected to reduce convection depths in the Labrador Sea; in turn, this would reduce the sequestration of anthropogenic carbon into the deep ocean (see Box 7.6). Such deep-ocean sequestration prevents carbon from coming in contact with the atmosphere for centuries. These changes are also expected to affect the strength of the Atlantic branch of the meridional overturning circulation and ocean conditions off Atlantic Canada, as well as global climate.

Global measures of ocean heat content and sea-level rise have provided indicators that anthropogenic climate change is changing the ocean on a global scale (Cheng et al., 201714). However, it is more difficult to determine the causes of observed changes at regional scales. Natural internal climate variability plays a larger role on regional spatial scales and on timescales of years to decades (see Chapter 2, Section 2.3.3). The large expanse of ocean surrounding Canada poses significant logistical challenges for climate monitoring, especially in the remote Arctic, and systematic monitoring programs beyond satellite remote sensing are somewhat limited. Inferences about the role of anthropogenic climate change from records of less than 50 years duration need to be made with caution, considering known contributions from natural variability (see Sections 7.2 and 7.3). Given the rapid changes occurring in the Arctic (e.g., air temperature increase, sea ice decline), signs of anthropogenic climate change have emerged there earlier than in ocean regions off southern Canada. Past and future changes in the atmosphere, cryosphere, and freshwater systems that are drivers of changes in the ocean are covered in the preceding chapters of this report. Key among these are rising air and sea surface temperatures (SST) (see Chapter 2, Section 2.2.1 and Chapter 4, Section 4.2), precipitation changes (Chapter 2, Section 2.2.2 and Chapter 4, Section 4.3), reductions in sea and land ice (Chapter 5, Sections 5.3 and 5.4), and changes in the seasonality and magnitude of streamflow from freshwater systems (Chapter 6, Section 6.2).

Climate variability detection and projection are more difficult for the coastal zones (involving small embayments and nearshore waters) surrounding Canada because of the highly irregular coastline and seabed topography; influences from atmosphere, land, and offshore ocean; and the sensitivity of coastal ocean circulation to the orientation of the coastline relative to the varying winds. Consequently, it is more difficult to make inferences from limited observations and coarse-scale climate models. However, some long-term coastal observation sites are representative of offshore waters (and also neighbouring coastal waters), as will be discussed in this chapter.

7.2

Ocean temperature

Key Message 1

Upper-ocean temperature has increased in the Northeast Pacific and most areas of the Northwest Atlantic over the last century, consistent with anthropogenic climate change (high confidence). The upper ocean has warmed in the Canadian Arctic in summer and fall as a result of increases in air temperature and declines in sea ice (medium confidence).

Key Message 2

Oceans surrounding Canada are projected to continue to warm over the 21st century in response to past and future emissions of greenhouse gases. The warming in summer will be greatest in the ice-free areas of the Arctic and off southern Atlantic Canada, where subtropical water is projected to shift further north (medium confidence). During winter in the next few decades, the upper ocean surrounding Atlantic Canada will warm the most, the Northeast Pacific will experience intermediate warming rates, and the Arctic and eastern sub-Arctic ocean areas (including Hudson Bay and Labrador Sea) will warm the least (medium confidence).

The ocean absorbs incoming radiation from the sun and greenhouse gases in the atmosphere, and stores it as heat in its upper layers, some of which eventually spreads to deeper waters. Water has a much higher heat capacity than air, meaning the ocean can absorb larger amounts of heat energy with smaller increases in temperature. Because it takes centuries for upper-ocean heat changes to spread to abyssal depths everywhere, the vertical extent of warming in the ocean is much less than in the lower atmosphere, even though it has absorbed more than 90% of the Earth’s extra accumulated heat since 1955. During 1971–2010, the upper 75 m of the global ocean warmed at a rate of 0.11°C per decade, but the warming rate was only 0.015°C per decade at 700 m (Rhein et al., 2013124).

Global average SST had a warming trend of 0.07°C per decade during 1900–2016 (Jewett and Romanou, 201780) and 0.1°C per decade during 1950–2016 (Huang et al., 201771). Similar to global mean combined air and sea surface temperature (see Chapter 2, Section 2.2.1), SST also shows a multi-decadal variation related to changes in greenhouse gas and aerosol emissions and to natural internal climate variability, and shorter-term variations mainly due to volcanic eruptions and El Niño and La Niña events. Regionally, SST is also influenced by other dominant modes of natural climate variability, such as the Atlantic Multi-decadal Oscillation, the North Atlantic Oscillation, and the Pacific Decadal Oscillation. These variability modes generally involve large-scale patterns in atmospheric and/or oceanic circulation, which result in changes in surface winds over the ocean and transfers of heat across the air-sea interface (see Chapter 2, Box 2.5).

7.2.1

Observations

Sustained temperature observations in the oceans surrounding Canada began in the early 20th century, but these time series are limited to a few locations. In the Arctic Ocean, there have been very few continuous observations, and those that do exist are limited to the last several decades. Ocean temperature observations have evolved from the 19th century sampling of the ocean from ships to a more systematic and near-global coverage from satellites for surface waters (e.g., Larouche and Galbraith, 201686) and Argo floats (autonomous profilers that measure the temperature and salinity of the upper 2000 m of the ocean) for the deep ocean (Riser et al., 2016125). Observations of subsurface ocean temperature on the continental shelves surrounding Canada continue to be acquired primarily through vertical profiles taken by research vessels, supplemented by continuous time series (typically with hourly sampling) from scattered moored instruments. This section will focus on long-term ocean temperature observations collected by Fisheries and Oceans Canada (DFO) monitoring programs, which draw on data from various sources of regular sampling initiated at some sites in the early 20th century. The site-specific time series presented in this section are representative of temperature over broader shelf and open-ocean regions (Ouellet et al., 2011111,  Petrie and Dean-Moore, 1996119).

7.2.1.1

Northeast Pacific Ocean

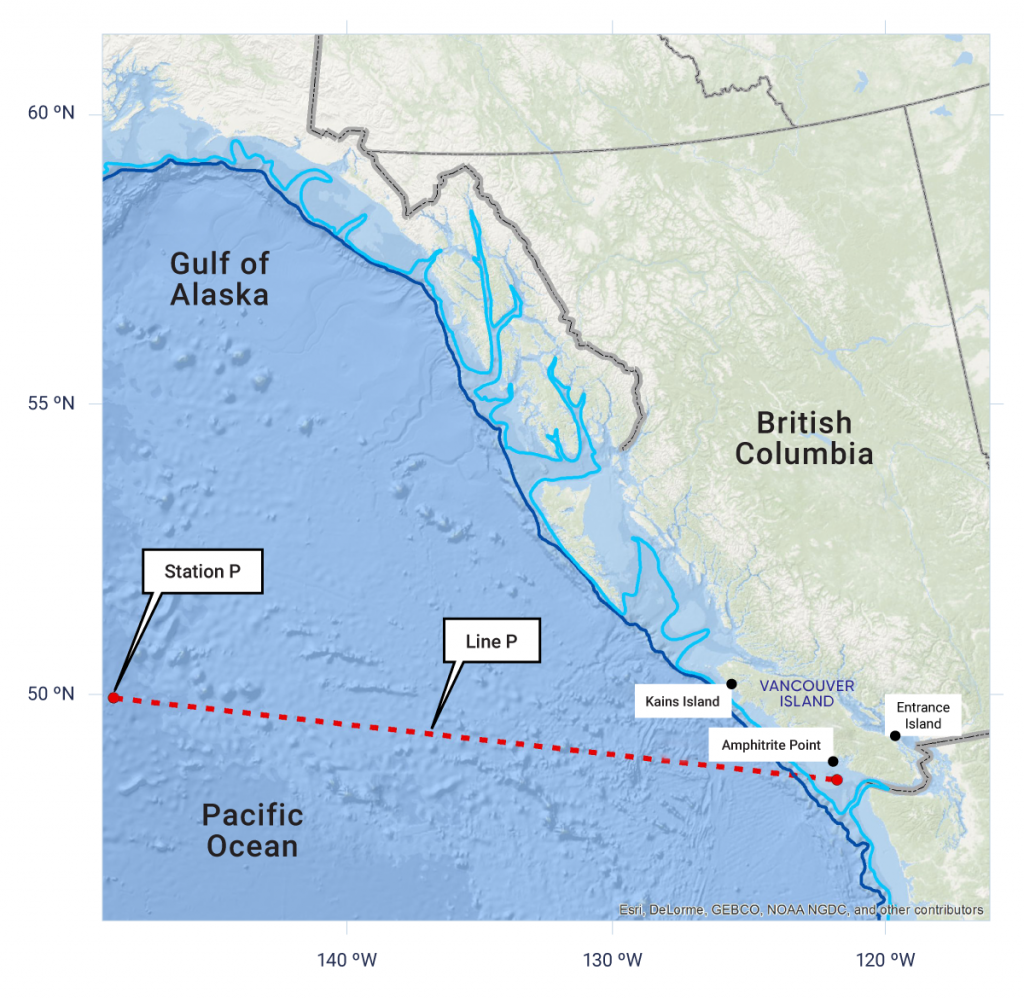
Sea surface and upper-ocean temperatures in the Northeast Pacific are strongly influenced by natural variability associated with the El Niño–Southern Oscillation (ENSO) and Pacific Decadal Oscillation (Christian and Foreman, 201316; Huang et al., 201771). On the west coast of Canada, DFO has two long-term monitoring programs that provide continuing ocean temperature data: the British Columbia Shore Station Oceanographic Program, which has coastal time series (representative of near-surface shelf waters) dating back to 1914 (Chandler et al., 201713), and the Line P program, which has been monitoring the deep ocean since 1956, out to the former Ocean Weather Station Papa (Crawford et al., 200723) (see Figure 7.2). Long-term warming trends of 0.08°C per decade have been observed at Amphitrite Point and Kains Island on the west coast of Vancouver Island and of 0.15°C per decade, at Entrance Island on the Strait of Georgia (see Figure 7.3). In the offshore upper ocean (10–50 m) at Station P, the long-term warming trend is 0.14°C per decade, while the subsurface (100–150 m) waters show a weaker warming (0.07°C per decade) and a decadal-scale variation similar in magnitude to that in the upper-ocean waters. These upper-ocean rates of increase are similar to SST trends (1950–2016) observed for the US Northwest (0.07°C per decade) and Alaska (0.12°C per decade) coastal regions (Jewett and Romanou, 201780).

Figure-7.2

Locations of monitoring sites in the North Pacific off British Columbia

Map showing locations of British Columbia Shore Station Oceanographic Program sites on the east (Entrance Island) and west (Amphitrite Point and Kains Island) coasts of Vancouver Island. Offshore ocean temperature, salinity and other observations are collected by the DFO Line P monitoring program extending out to Station P, which is the former location of the Ocean Weather Station Papa, about 1,400 km west of Vancouver Island.
Figure-7.2

Map showing locations of British Columbia Shore Station Oceanographic Program sites on the east (Entrance Island) and west (Amphitrite Point and Kains Island) coasts of Vancouver Island. Offshore ocean temperature, salinity and other observations are collected by the DFO Line P monitoring program extending out to Station P, which is the former location of the Ocean Weather Station Papa. The 200 m and 1000 m depth contours are indicated by the light and dark blue lines.

Source

Fisheries and Oceans Canada

Figure-7.3

Annual mean temperatures in the Northeast Pacific Ocean off British Columbia

Time series of annual mean ocean temperature at DFO coastal and offshore locations on the west coast of Canada. The coastal locations provide records of near-surface temperature for the period 1935–2017. On the east coast of Vancouver Island (Entrance Island), a positive trend of 0.15°C per decade has been observed, significant at 1% level (there is only a 1% possibility that such changes are due to chance), and on the west coast (Amphitrite Point and Kains Island), a positive trend of 0.08°C per decade, significant at 1% level. Offshore temperatures from Station P for the period 1956–2017 are shown for depth ranges representative of the seasonally varying upper ocean (10–50 m), where a positive trend of 0.14°C per decade has been observed, significant at 1% level, and the permanent thermocline (layer in which temperature decreases strongly with depth; 100–150 m), where a positive trend of 0.07°C per decade has been observed, significant at 5% level.
Figure-7.3

Coastal temperature time series collected at DFO monitoring sites on the east (Entrance Island, positive trend 0.15°C per decade, significant at 1% level [there is only a 1% possibility that such changes are due to chance]) and west (Amphitrite Point and Kains Island, positive trend 0.08°C per decade, significant at 1% level) coasts of Vancouver Island. Offshore ocean temperature at Station P is presented for the upper ocean (10–50 m, positive trend 0.14°C per decade, significant at 1% level) and the depth range of the permanent thermocline (layer in which temperature decreases strongly with depth; 100–150 m, positive trend 0.07°C per decade, significant at 5% level).

Source

Data from DFO monitoring programs. British Columbia Shore Station Oceanographic Program <http://www.pac.dfo-mpo.gc.ca/science/oceans/data-donnees/lightstations-phares/index-eng.html>. Line P monitoring program <http://www.dfo-mpo.gc.ca/science/data-donnees/line-p/index-eng.html>.

7.2.1.2

Northwest Atlantic Ocean

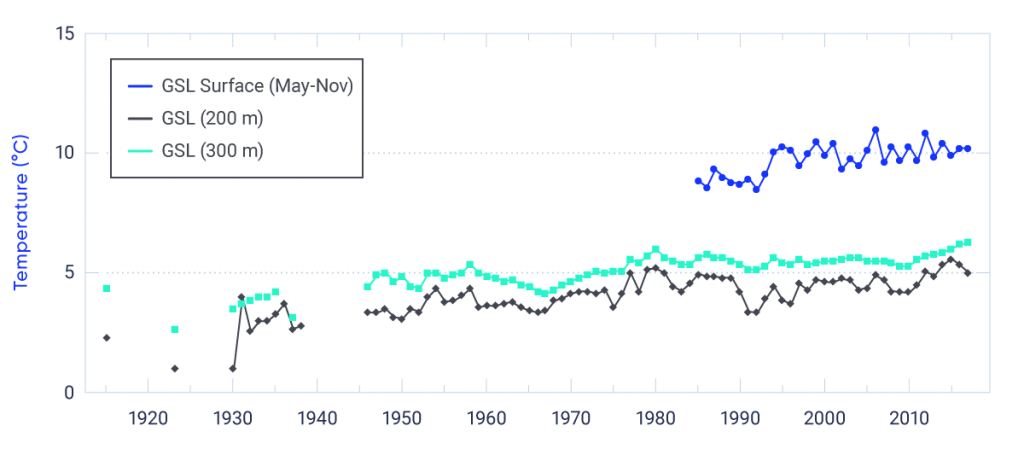
In the Northwest Atlantic Ocean off the Atlantic provinces (Figure 7.4), long-term warming trends are apparent from in situ data (Galbraith et al., 201745; Hebert et al., 201666) collected in the Gulf of St. Lawrence, Scotian Shelf, and Gulf of Maine (Figure 7.5 and Figure 7.6). Variability in annual mean surface temperature since 1985 in the Gulf of St. Lawrence has been highly correlated with that in regional air temperature, including a warming trend (Galbraith et al., 201246). The higher near-bottom warming rate (0.23°C per decade) is related to an increasing influence of subtropical waters from the Gulf Stream transported at depth into the Laurentian Channel (Gilbert et al., 200549), a submarine valley running from the mouth of the St. Lawrence River, through the Gulf of St. Lawrence, to the edge of the continental shelf.

Figure-7.4

Sampling locations in the Northwest Atlantic Ocean off the Atlantic provinces

identifying areas of the Northwest Atlantic Ocean in which temperature and salinity time series are presented in this report. These areas include the Labrador Sea, Newfoundland Shelf, Scotian Shelf, Gulf of St. Lawrence, and Bay of Fundy. Ocean observations are collected by DFO Atlantic zone monitoring programs.
Figure-7.4

Map identifying areas of the Northwest Atlantic Ocean in which temperature and salinity time series are presented in this report. These areas include the Labrador Sea, Newfoundland Shelf, Scotian Shelf, Gulf of St. Lawrence, and Bay of Fundy. Ocean observations are collected by DFO Atlantic zone monitoring programs. The 200 m and 1000 m depth contours are indicated by the light and dark blue lines.

Source

Fisheries and Oceans Canada

Figure-7.5

Ocean temperature in the Gulf of St. Lawrence

Three time series of ocean temperature for the surface and at depths of 200 and 300 m in the Gulf of St. Lawrence collected by DFO monitoring programs. Sea surface temperature from advanced very-high-resolution radiometer satellite observations is averaged over the seasonal ice-free period (May to November) for the years 1985 to 2017. The observed positive trend is 0.46°C per decade (significant at 1% level). Temperature from in situ observations at depths of 200 m and 300 m are shown for the period 1915 to 2017. At 200 m, there is a positive trend of 0.25°C per decade (significant at 1% level) and at 300 m, a positive trend of 0.23°C per decade (significant at 1% level), indicating warming in the deep Gulf of St. Lawrence over the past half century.
Figure-7.5

Ocean temperature time series for the surface and at depths of 200 and 300 m in the Gulf of St. Lawrence collected by DFO monitoring programs. Sea surface temperature (May to November average, ice-free period) from advanced very-high-resolution radiometer satellite observations (1985–2017, positive trend of 0.46°C per decade, significant at 1% level). Temperature from in situ observations at depths of 200 m (1915–2017, positive trend of 0.25°C per decade, significant at 1% level) and 300 m (1915–2017, positive trend of 0.23°C per decade, significant at 1% level) indicate warming in the deep Gulf of St. Lawrence over the past half-century.

Source

Data from DFO monitoring programs (Galbraith et al., 2012; Galbraith et al., 2017). Atlantic Zone Monitoring Program <http://www.meds-sdmm.dfo-mpo.gc.ca/isdm-gdsi/azmp-pmza/index-eng.html>

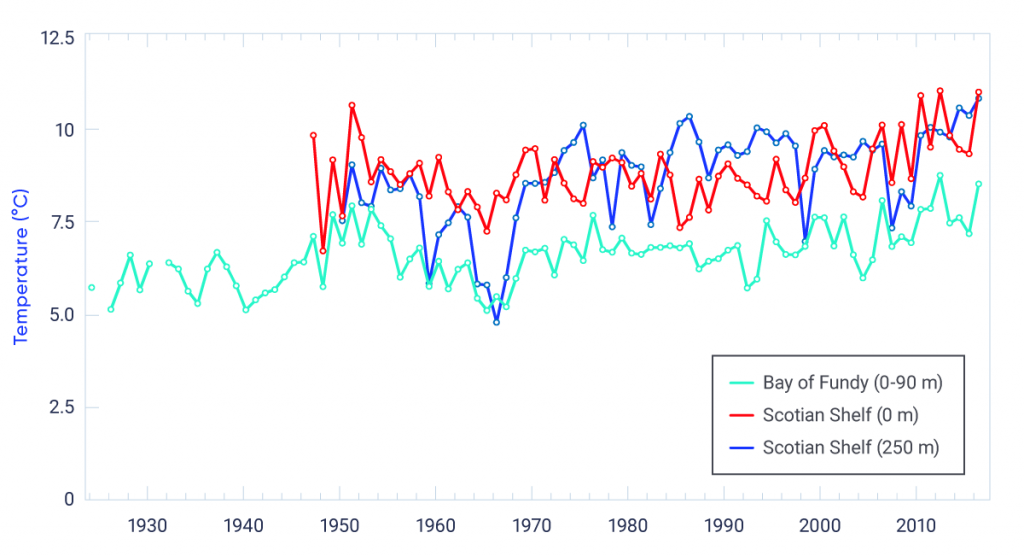
Figure-7.6

Annual mean temperatures in the Scotian Shelf and the Bay of Fundy

Two time series of ocean temperature in the Scotian Shelf and one for the Bay of Fundy collected by DFO monitoring programs. Long-term increases are observed from in situ sea surface temperature for the Scotian Shelf and in temperature at a depth of 250 m for the Emerald Basin region of the Scotian Shelf. The increasing sea surface temperature trend for 1947–2016 is 0.15°C per decade (significant at 1% level), while that for the Emerald Basin is 0.36°C per decade (significant at 1% level). Ocean temperature averaged over 0–90 m depth from the Prince 5 station in the Bay of Fundy over the period 1924 to 2016 shows a positive trend of 0.16°C per decade (significant at 1% level), indicating a similar long-term warming trend.
Figure-7.6

Ocean temperature time series in the Scotian Shelf and one for the Bay of Fundy collected by DFO monitoring programs. Long-term increases are observed from in situ sea surface temperature (0 m, 1947–2016, positive trend of 0.15°C per decade, significant at 1% level) and for the deeper layer (250 m, 1947–2016, positive trend of 0.36°C per decade, significant at 1% level) of the Emerald Basin region of the Scotian Shelf. Depth-averaged ocean temperature (0–90 m) from the Prince 5 station in the Bay of Fundy (1924–2016, positive trend of 0.16°C per decade, significant at 1% level) indicates a similar long-term warming trend.

Source

Data from DFO monitoring programs (Hebert et al., 2016). Atlantic Zone Monitoring Program <http://www.meds-sdmm.dfo-mpo.gc.ca/isdm-gdsi/azmp-pmza/index-eng.html>

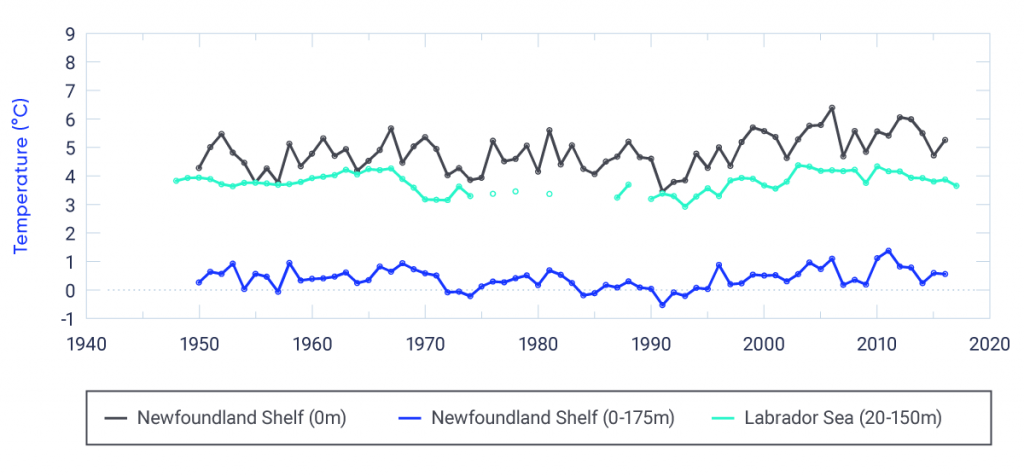
In contrast to the areas discussed above (which are west of the Grand Banks and the island of Newfoundland), no significant warming trend in the past century has been shown in temperature averaged over all depths at the Newfoundland Shelf monitoring site (Station 27, see Figure 7.4) nor in the upper ocean (averaged over 20–150 m) in the central Labrador Sea near the former Ocean Weather Station Bravo site (Colbourne et al., 201719; Yashayaev and Loder, 2017163). However, surface warming is evident over the past several decades on the Labrador and Newfoundland Shelves, as illustrated by the warming trend of 0.13oC per decade at Station 27 since 1950 (see Figure 7.7).

Figure-7.7

Annual mean temperatures in the Newfoundland Shelf and Labrador Sea

Three time series of ocean temperature in the Newfoundland Shelf and Labrador Sea collected by DFO monitoring programs. Sea surface temperature on the Newfoundland Shelf at AZMP Station 27 near St. John’s increased by 0.13°C per decade, significant at 1% level (there is only a 1% possibility that this trend is due to chance) over the period 1950 to 2016. No long-term increase in ocean temperature averaged over depths of 0 to 175 m was observed from 1950 to 2016 at this site. Upper-ocean temperature, averaged over depths from 20 to 150 m of the central Labrador Sea basin (OWS Bravo), does not demonstrate long-term warming over the period 1948 to 2016.
Figure-7.7

Ocean temperature time series in the Newfoundland Shelf and Labrador Sea collected by DFO monitoring programs. Sea surface temperature (0 m) on the Newfoundland Shelf at AZMP Station 27 near St. John’s (1950–2016, positive trend of 0.13°C per decade, significant at 1% level [there is only a 1% possibility that the trend is due to chance]) and depth-averaged ocean temperature (0–175 m) from that site (1950–2016, non-significant positive trend of 0.02°C per decade). Upper-ocean temperature (20–150 m) of the central Labrador Sea basin (OWS Bravo) does not demonstrate long-term warming (1948–2016, non-significant positive trend of 0.03°C per decade).

Source

Data from DFO monitoring programs (Colbourne et al., 2017; Yashayaev and Loder, 2017). Atlantic Zone Monitoring Program <http://www.meds-sdmm.dfo-mpo.gc.ca/isdm-gdsi/azmp-pmza/index-eng.html>. Atlantic Zone Off-shelf Monitoring Program <http://www.bio.gc.ca/science/monitoring-monitorage/azomp-pmzao/azomp-pmzao-en.php>.

Confidence in the Northwest Atlantic temperature changes over the last century is strengthened by comparisons of in situ measurements from DFO monitoring sites (Colbourne et al., 201719; Galbraith et al., 201745; Hebert et al., 201666; Yashayaev and Loder, 2017163) with three global monthly interpolated SST datasets that extend back to the late 19th century (Loder and Wang, 201593). Trends in annual mean SST off Atlantic Canada since 1900 and 1950 are generally similar to global ones (Jewett and Romanou, 201780), except in the offshore Labrador Sea, where trends are weak (and not statistically significant). Trends since 1981 are generally two to three times larger than the longer-term ones, due to a combination of anthropogenic global warming and a warming phase of the Atlantic Multi-decadal Oscillation since the 1970s (Loder and Wang, 201593).

The absence of a long-term warming trend in the subpolar Labrador Sea region is consistent with the large area south of Greenland, where there has been no net warming observed in surface air and water temperatures over the past century (Lozier et al., 200897; IPCC, 201376; Loder and Wang, 201593). This is usually attributed to the predominance of natural climate variability in this area (e.g., Delworth and Zeng, 201628) and a possible reduction in the strength of Atlantic Meridional Overturning Circulation (e.g., Rahmstorf et al., 2015122). An example of the importance of (and the pitfalls associated with) decadal-scale variability in the Northwest Atlantic is provided by the longest available temperature record from moored instruments off Atlantic Canada, specifically from a depth of 1000 m on the Labrador Slope. This record showed little (less than 0.2°C) net warming between 1987 and 2015 but warming by over 0.5°C between 1995 and 2011 as a result of record deep convection and subsurface cooling in the Labrador Sea during the early 1990s (Yashayaev and Loder, 2016162). Longer time series of temperatures from the central Labrador Sea (see Figure 7.7) indicate no net warming of this water mass (which is of importance to the Atlantic Meridional Overturning Circulation) since 1950. Clearly, caution is warranted in inferring anthropogenic climate change from observational records of only a few decades’ duration in the Atlantic and Pacific Ocean waters off Canada. To date, natural decadal-scale variability in these waters is of comparable magnitude to that of global anthropogenic climate change.

Changes in seasonality of SST in Atlantic Canada in recent decades have been studied by determining when threshold spring- and fall-like temperatures were reached each year, estimated from satellite data (Galbraith and Larouche, 201344). All regions of Atlantic Canada experienced earlier spring warming between 1985 and 2011, with trends varying between 0.6 weeks per decade earlier on the Scotian Shelf to 1.6 weeks per decade earlier on the Labrador Shelf. However, only a few limited regions experienced trends statistically different from zero for changes in the timing of fall cooling, with rates of 0.5 to 0.7 weeks per decade later in the year. If these changes were associated entirely with atmospheric warming, some regions of Atlantic Canada could see summertime SST conditions extended by as much as two weeks for each overall 1°C increase in regional air temperature. Over the period 1982–2014, it has been similarly estimated that summer duration increased by as much as three weeks per decade in the Scotian Shelf–Gulf of Maine region (Thomas et al., 2017139), but this change likely includes a significant contribution from decadal-scale variability.

7.2.1.3

Arctic Ocean

Detecting and understanding climate change in the Canadian sector of the Arctic Ocean over the last century present challenges owing to the lack of adequate long-term observational records. However, there is strong evidence that surface air temperatures have increased in the Canadian Arctic and that sea ice extent and volume have declined (see Chapter 4, Section 4.2.1 and Chapter 5, Section 5.3.1). These changes point to associated upper-ocean warming in the region (especially considering the heat involved in changing sea ice to ocean water).

Satellite observations indicate that the August SST in most seasonal open-water areas in the Beaufort Sea, Hudson Bay, and Baffin Bay increased by more than 0.5°C per decade during 1982–2017 (Timmermans et al., 2018142; also see Larouche and Galbraith, 201686) but also indicate limited or no warming in other areas (which may just reflect sparse data in marginal ice zones). In the Beaufort Sea at 50 m depth on the mid-continental shelf, no significant trend has been observed over the past 25 years (Steiner et al., 2015137). This lack of a temperature trend is consistent with observations of the upper-ocean mixed layer in the southern Beaufort Sea and the Canada Basin (one of two basins in the Arctic Ocean; Peralta-Ferriz and Woodgate, 2015113). In the off-shelf basins of the Arctic Ocean, subsurface temperatures (at 150–900 m depth) have increased by 0.48°C per decade since 1970 (Polyakov et al., 2012120).

In the Canadian Arctic Archipelago, temperatures near the seabed at 145 m depth in the western Lancaster Sound have increased by about 0.2°C (2002–2011), indicating a warming of the deeper layer of Arctic water passing through this passage into the Northwest Atlantic (Hamilton and Wu, 201357; Steiner et al., 2015137). For the Baffin Island Shelf, no trend in temperature can be identified in the upper 50 m layer (1950–2005), but in the 50–200 m layer there is a slight cooling trend of 0.05°C per decade (Hamilton and Wu, 201357; Zweng and Münchow, 2006171). In central Baffin Bay, a cooling trend of about 0.16°C per decade has been observed in the surface (0–50 m) and no trend observed in the 50–200 m layer since 1950, and a warming trend of about 0.13°C per decade has been seen in the deep basin (600–800 m) since 1960 (Hamilton and Wu, 201357; Zweng and Münchow, 2006171).

7.2.2

Future projections

Because the heat capacity of water is much higher than that of air, anthropogenic ocean warming is expected to be somewhat less than that in the lower atmosphere over land, except possibly in some places where there are changes in ocean circulation (e.g., the warm Gulf Stream shifting northward). Projections from models in the fifth phase of the Coupled Model Intercomparison Project (CMIP5; see Chapter 3, Box 3.1) used in the Intergovernmental Panel on Climate Change’s (IPCC’s) Fifth Assessment Report (AR5) generally indicate widespread warming of the upper oceans around Canada during the 21st century, with greater warming for higher emission scenarios. Substantial variability is evident between seasons and from one region to another (Loder et al., 201594; Christian and Holmes, 201617, Steiner et al., 2015137; Christian and Foreman, 201316). Projected changes in SST to mid-century (average for 2046–2065 relative to that for 1986–2005) for a high emission scenario (RCP8.5) have been computed as the ensemble mean of six of the CMIP5 models (Loder et al., 201594). Global emissions since 2005 (e.g., Peters et al., 2013117; 2017118), and climate-policy decisions (e.g., Sanford et al., 2014129) have been closer to this scenario than to the low emission scenario (RCP2.6). The projected mid-century SST increases for the medium emission scenario (RCP4.5) are about 70% of those for RCP8.5 with similar spatial patterns, consistent with the scalability of projected air temperature changes discussed in Chapter 4 (also see Markovic et al., 2013100). As a good approximation, these projected increases can be taken to apply until mid-century, assuming only limited further reductions in emissions.

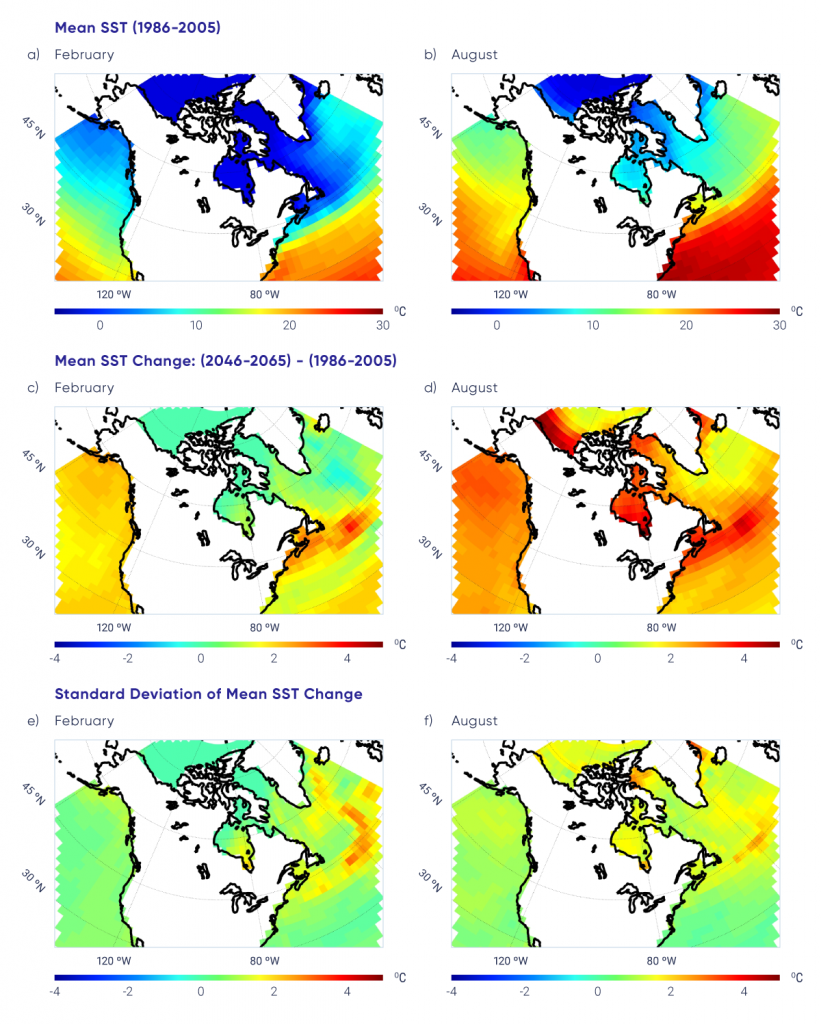
In the Northeast Pacific off British Columbia, the projected SST increases to mid-century are roughly 2°C in winter and 3°C in summer, with a small and smooth increase with latitude (see Figure 7.8). In contrast, the projected increases in Canadian Arctic waters (including Hudson Bay) and the Northwest Atlantic have larger seasonal and spatial variations. The projected SST changes in the Arctic in winter are very small (because of the projected continued presence of winter sea ice), but those in summer are up to 4°C in areas such as the Beaufort Sea and Hudson Bay, where reduced sea ice cover is projected. The CMIP5 models do not have adequate spatial resolution and representations of sea ice and ocean physics in the complex Canadian Arctic Archipelago to reliably project the details of ocean temperature changes in summer and fall there, but substantial spatial structure in the ocean changes associated with changes in sea ice can be expected (e.g., Sou and Flato, 2009135; Hu and Myers, 201470; Steiner et al., 2015137). Reliable projections of ocean conditions in this region will probably require a combination of higher spatial resolution in global climate models and inclusion of both sea ice and ocean components in the regional climate models used in dynamical downscaling (see Chapter 3.5).

Figure-7.8

Projected future sea surface temperatures in oceans surrounding Canada

Six-panel figure with colour-coded maps of sea surface temperature (SST) and future temperature change for the oceans surrounding Canada. Both current and future SST are mean values from the fifth phase of the Coupled Model Intercomparison Project (CMIP5) multi-model ensemble. The upper two panels show mean SST for the period 1986–2005 in February and August. These panels show large temperature differences from north to south in the oceans off southern Atlantic Canada and smaller differences changes off the west coast of Canada. The middle row of the figure shows the change in mean SST from current conditions to mid-century under the high emission scenario (RCP8.5) for February and August. These panels show that, by mid-century, SST increases will be larger in August than February for most regions of the oceans surrounding Canada. The projected increase of about 2°C to 3°C in SST off the west coast is very uniform in space. In the Arctic, the largest increases are expected in the summer period in the southern Beaufort Sea and Hudson Bay. The ocean waters around the Atlantic provinces are projected to increase by about 2°C to 4°C in both the winter and summer period, but the northern region off Labrador is expected to experience smaller changes. The lower two panels in the figure present the standard deviation in SST change for the modelled projections shown in the middle panels. In general, the standard deviation is small, indicating agreement among models, except for the regions south of Nova Scotia, Newfoundland, and Greenland; this can be attributed to the difficulty in modelling the ocean dynamics of these regions.
Figure-7.8

Fifth phase of the Coupled Model Intercomparison Project (CMIP5) ensemble mean sea surface temperature (SST) for the period of 1986–2005 (top row) for February (a) and August (b). Change in the mean SST for mid-century (2046–2065) relative to 1986–2005 for February (c) and August (d) for the high emission scenario (RCP8.5). Standard deviation in the SST change for mid-century relative to 1986–2005 for February (e) and August (f). In general, the standard deviation is small, indicating agreement among models, except for northern Baffin Bay and the regions south of Nova Scotia, Newfoundland, and Greenland; this can be attributed to the difficulty in modeling the ocean dynamics of these regions.

Air temperature increases are projected to be larger than the SST increases in most parts of the Northwest Atlantic (Loder et al., 201594), consistent with atmospheric warming being the primary driver of ocean warming (e.g., Collins et al., 201320; Hegerl et al., 200767). The latitudinal variation of future SST change in offshore waters will be different from the increase with latitude of air temperature over the land associated with Arctic amplification. In contrast to air temperature for Canada as a whole, the SST increase in the Northwest Atlantic is projected to be largest at mid-latitudes and smaller proceeding north into subpolar waters. Winter SST increases by mid-century of up to 3°C off the Maritime provinces, but only 1°C off Labrador, are projected for the high emission scenario (RCP8.5). Similarly, mid-century summer SST increases of up to 4°C are projected off the Maritime provinces, but increases are limited to 2°C off Labrador. The mid-latitude maximum in the SST increase is related to projected changes in large-scale ocean circulation and to a slight northward expansion of the subtropical gyre (and shift of the Gulf Stream), in particular.

In the North Atlantic south of Greenland, most models indicate that future warming will be more limited, with the Atlantic Meridional Overturning Circulation transporting less heat northward (Drijfhout et al., 201232). However, substantial uncertainty remains about the potential for significant reduction of this circulation in the future, due to the complexity of the atmosphere–ice–ocean system in the Northwest Atlantic and the limited capability of current climate models to simulate important processes in this complex system (Sgubin et al., 2017131).

As is the case for the Canadian Arctic Archipelago, the coarse horizontal resolution of the ocean in the CMIP5 Earth system models (of approximately 100 km) poses a challenge for modelling the ocean off Atlantic Canada, where the coastline and seafloor topography are complex. This results in a warm bias in SST due to a misrepresentation of the boundary between the subpolar and subtropical gyres; thus, existing climate change projections are based on a modelled regional ocean circulation that differs from current reality (Loder et al., 201594; Saba et al., 2016127). This is important for Atlantic Canada, in particular, which is in a region of large spatial differences in ocean temperature (Figure 7.1). Regional climate downscaling has provided detailed information on the spatial structure of potential changes for Atlantic Canada (Long et al., 201696), but the overall magnitude of the changes is uncertain.


Section summary

In summary, upper-ocean temperature has increased in the Northeast Pacific and most areas of the Northwest Atlantic over the last century, consistent with anthropogenic climate change (high confidence). This statement of confidence is based on high-quality in situ observations of sea surface and subsurface temperature, which are generally consistent with the regional variations in global interpolated SST datasets. The number of locations with long subsurface time series is limited and, although these data are expected to be representative of large areas, there is lower confidence in them. Natural decadal variability is comparable in magnitude to the long-term changes in ocean temperature; there is a region south of Greenland where there has been little or no warming over the last century. There are no long-term ocean temperature measurements for the Arctic Ocean, but warming is expected to have occurred in the summer and fall periods, based on observed increases in air temperature (see Chapter 4, Section 4.2.1.1) and declines in sea ice (see Chapter 5, Section 5.3.1) (medium confidence). This statement of confidence is based on a few short temperature time series and on expert judgment of the coupling of the atmosphere, cryosphere, and upper ocean.

Oceans surrounding Canada are projected to continue to warm over the 21st century in response to past and future emissions of greenhouse gases. The warming in summer will be greatest in the ice-free areas of the Arctic and off southern Atlantic Canada where subtropical water is projected to shift further north (medium confidence). During winter in the next few decades, the upper ocean surrounding Atlantic Canada will warm the most, the Northeast Pacific will experience intermediate warming rates, and the Arctic and eastern sub-Arctic ocean areas (including Hudson Bay and Labrador Sea) will warm the least (medium confidence). These statements of confidence are based on an analysis of six CMIP5 model projections of SST for the oceans surrounding Canada, which show an increase in SST in all seasons in the Northeast Pacific and Northwest Atlantic oceans. The statements are also based on physical understanding of the processes related to increasing surface air temperature, resulting in a positive heat transfer to the ocean surface waters. The level of confidence is medium rather than high owing to differences in the regional projections from the Earth system models.

7.3

Ocean salinity and density stratification

Key Message 1

There has been a slight long-term freshening of upper-ocean waters in most areas off Canada as a result of various factors related to anthropogenic climate change, in addition to natural decadal-scale variability (medium confidence). Salinity has increased below the surface in some mid-latitude areas, indicating a northward shift of saltier subtropical water (medium confidence).

Key Message 2

Freshening of the ocean surface is projected to continue in most areas off Canada over the rest of this century under a range of emission scenarios, due to increases in precipitation and melting of land and sea ice (medium confidence). However, increases in salinity are expected in off-shelf waters south of Atlantic Canada due to the northward shift of subtropical water (medium confidence). The upper-ocean freshening and warming is expected to increase the vertical stratification of water density, which will affect ocean sequestration of greenhouse gases, dissolved oxygen levels, and marine ecosystems.

The ocean is a key component of the Earth’s water cycle (see Chapter 6, Figure 6.1), and changes in the rates of evaporation and precipitation are reflected in the relative freshness or salinity of the ocean surface water (Helm et al., 201068). Salinity can also change in response to freshwater runoff from the continent, melting and freezing of sea ice (see Box 7.3), and ocean circulation and mixing. Changes near the sea surface affect the ocean interior (intermediate and deep layers) through processes such as vertical mixing and deep convection (e.g., Yashayaev and Loder, 2016162). Ocean salinity, together with temperature and pressure (depth), determines the density of seawater, which, in turn, affects ocean circulation, vertical density stratification (see Box 7.4), and vertical mixing. The differences in sea surface salinity between different areas of the global ocean have become stronger since the 1950s. Relatively saline surface waters in the evaporation-dominated lower mid-latitudes have become more saline, while relatively fresh surface waters in rainfall-dominated tropical and ice-influenced polar regions have become fresher (Rhein et al., 2013124).

7.3.1

Observations

Ocean salinity observations have been made since the late 19th century by research cruises. The coverage of these observations is, however, more sparse than observations of temperature, as salinity is more difficult to measure than temperature. Observations of ocean salinity on the continental shelves surrounding Canada are primarily acquired through vertical profiles taken by research vessels, supplemented by continuous time series from sparse moored instruments.

7.3.1.1

Northeast Pacific Ocean

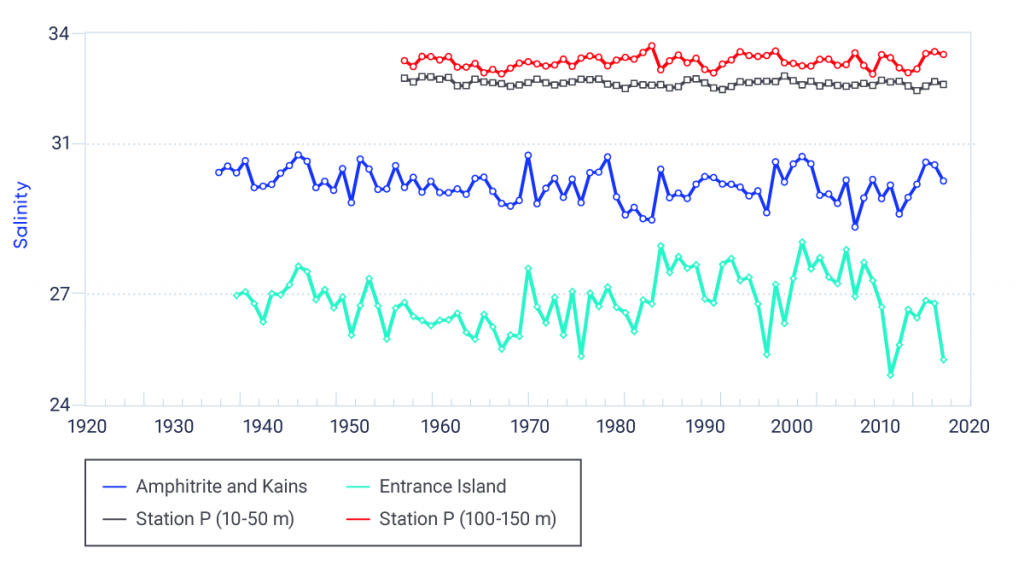
As with ocean temperatures in the North Pacific (see Section 7.2.1.1), sea surface salinity is strongly influenced by natural variability associated with the seasons, freshwater runoff from land, and longer-term processes such as ENSO and the Pacific Decadal Oscillation. Observations at offshore Station P show a slight long-term freshening (a decline in salinity of 0.015 per decade2) near the surface and a slight long-term salinity increase (but not statistically different from zero) at depth (see Figure 7.9). Coastal waters along the west coast of Vancouver Island show slight freshening (a decline of 0.043 per decade), which is consistent with Station P, while those along the east coast (in the Strait of Georgia) show slight salinity increases of the same magnitude. The complexity of freshwater runoff contributes to the variability observed at these coastal stations.

Figure-7.9

Ocean salinity changes in the Pacific Ocean off Canada’s west coast

Four line graphs show trends of ocean salinity at coastal and offshore locations on the west coast of Canada. Long-term positive trends in these time series are small but statistically different from zero, at 5% level (there is only a 5% possibility that the trend is due to chance) for the Station P near-surface layer over the period 1956 to 2017 and for Ampritrite and Kains Islands for 1935 to 2017. Interannual and decadal variability is large at Entrance Island off the east coast of Vancouver Island relative to the sites on the west coast of Vancouver Island and at Station P, and the long-term trend is not statistically different from zero. The long-term salinity trend is not statistically different from zero in the deep layer at Station P either.
Figure-7.9

Annual mean salinity in the Pacific Ocean off British Columbia at same sites as the mean temperature in Figure 7.2. Long-term trends in these times series are small but statistically different from zero for the Station P (10–50 m) near-surface layer (1956–2017, declining trend of 0.015 per decade, significant at 5% level, (there is only a 5% possibility that the trend is due to chance]) and Amphitrite and Kains Islands (1935–2017, declining trend of 0.043 per decade, significant at 5% level). Interannual and decadal variability is large at Entrance Island (east Vancouver Island) relative to the sites on the west coast of Vancouver Island and at Station P. Long-term trends are not statistically different from zero at Entrance Island (1937–2017, increasing trend of 0.038 per decade) nor at Station P (100–150 m) deep layer (1956–2017, increasing trend of 0.013 per decade).

Source

Data are from DFO monitoring programs. British Columbia Shore Station Oceanographic Program <http://www.pac.dfo-mpo.gc.ca/science/oceans/data-donnees/lightstations-phares/index-eng.html>. Line P monitoring program <http://www.dfo-mpo.gc.ca/science/data-donnees/line-p/index-eng.html>.

Stratification of the upper ocean along Line P increased over the period 1956 to 2011 (Freeland, 201343). This is primarily driven by the freshening of the near-surface waters (Durack and Wijffels, 201034; Durack et al., 201235), supplemented by the tendency toward increasing salinity below 100 m.

7.3.1.2

Northwest Atlantic Ocean

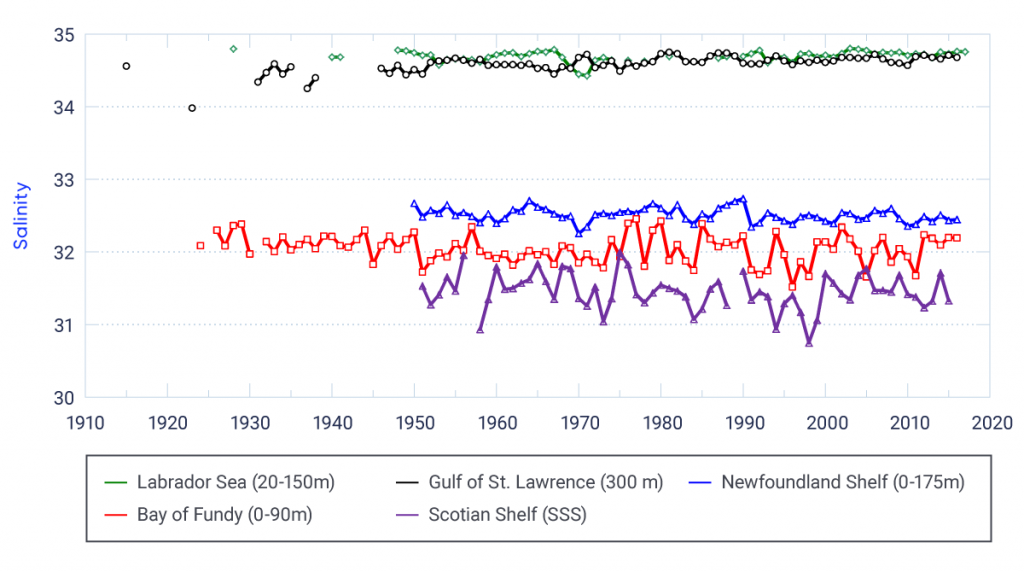
Off the Atlantic coast, long-term salinity changes have generally shown a slight freshening (decreasing) trend of the upper ocean and an increasing trend in the deep water of the Gulf of St. Lawrence (see Figure 7.10). The multiple factors that contribute to the long-term trends in salinity are partly offsetting at mid-latitudes, such that decade-to-decade natural variability is important. On the Newfoundland Shelf, there was a freshening, with salinity declining by about 0.013 per decade (Colbourne et al., 201719). In the central Labrador Sea and Bay of Fundy, the upper ocean has a similar weak trend to that observed on the Newfoundland Shelf but it is not statistically different from zero (Hebert et al., 201666; Yashayaev et al., 2014161; Yashayaev and Loder, 2016162). The largest and most robust salinity trend in Atlantic Canadian waters has been found in the deep (200–300 m below the surface) waters of the Gulf of St. Lawrence, where there has been a statistically significant increase in salinity of 0.019 per decade over the past 90 years. This trend is consistent with a northward shift of higher-salinity subtropical waters, which is also indicated by temperature (see Section 7.2.1.2) and oxygen (see Section 7.6.2) observations (Gilbert et al., 200549; Galbraith et al., 201745).

Figure-7.10

Ocean salinity changes in the Atlantic Ocean off Canada’s east coast

Line graph showing five time series of ocean salinity off Atlantic Canada. The Gulf of St. Lawrence (300 m depth) long-term trend is positive, in contrast to the other sites, which all have negative trends. The decreasing trend on the Newfoundland Shelf is statistically different from zero. The remaining sites (Labrador Sea, Scotian Shelf (Emerald Basin), and Bay of Fundy) do not have long-term trends that are statistically different from zero.
Figure-7.10

Annual mean salinity at representative sites from five different areas off Atlantic Canada, from Fisheries and Oceans Canada (DFO) monitoring programs. The Gulf of St. Lawrence (300 m depth) long-term trend is significantly positive (1915–2016, trend 0.019 per decade, significant at 1% level), in contrast to the other sites, which all have negative trends. The decreasing trend on the Newfoundland Shelf (Station 27, 0–175 m, 1950–2016, declining trend of 0.013 per decade, significant at 5% level) is statistically different from zero. The remaining sites do not have trends that are statistically different from zero (Labrador Sea, 20–150 m, 1928–2012, declining trend of 0.005 per decade; Scotian Shelf (Emerald Basin), 1951–2016, declining trend of 0.022 per decade; Bay of Fundy, 0–90 m, 1924–2016, declining trend of 0.009 per decade).

Source

Data are from DFO monitoring programs (Hebert et al., 2016; Colbourne et al., 2017; Galbraith et al., 2017; Yashayaev and Loder, 2017).

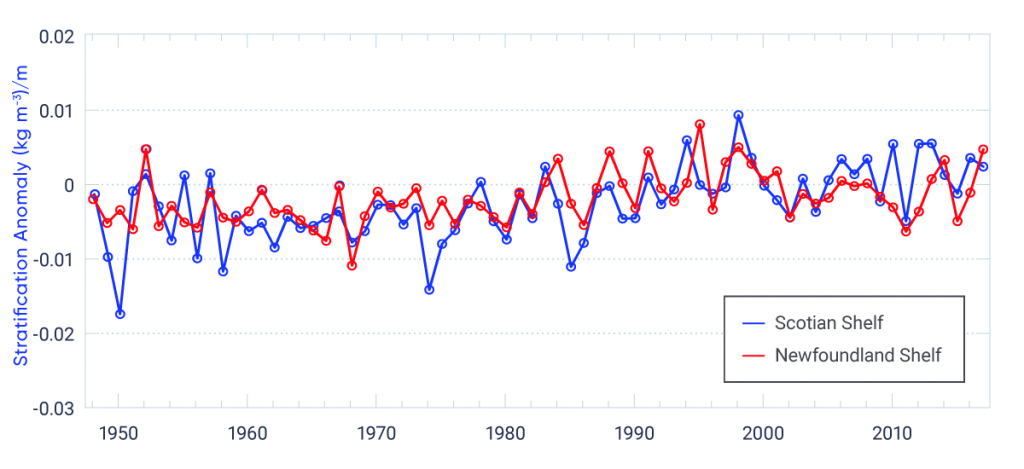
There is evidence of a long-term increase in upper-ocean stratification for the period 1948–2017, with the rate on the Scotian Shelf being about twice that observed on the Newfoundland Shelf (see Figure 7.11). This trend is a result of long-term changes in both surface temperature and salinity. In general, these trends are consistent with positive trends in stratification observed for many areas over the continental shelves in Atlantic Canada, which were assessed over the 1951–2009 period (Hebert, 201365). However, it is also evident that multi-decadal natural variability is an important influence on stratification in this area (see Figure 7.11). There are some regions where there has been decreasing stratification in the last few decades, such as the western Gulf of St. Lawrence and St. Lawrence Estuary, which are strongly influenced by changes in freshwater discharges (Galbraith et al., 201745).

Figure-7.11

Ocean stratification changes on the Scotian Shelf and Newfoundland Shelf

Line graph showing two time series of upper-ocean stratification off Atlantic Canada, for the Scotian Shelf and Newfoundland Shelf regions. The long-term trend (over the period 1948 to 2017) is significantly positive (at 1% level) for both the Scotian Shelf and the Newfoundland Shelf, indicating increasing stratification in these areas.
Figure-7.11

Stratification index (density difference from the ocean surface [0 m] to the depth of-50 m) is expressed as a mean annual anomaly (departure from normal) for the period 1948–2017. The time series for the Scotian Shelf is derived from data collected from several areas across the shelf, which are combined to provide one annual anomaly estimate. The time series for the Newfoundland Shelf is based on data collected at the AZMP Station 27. The long-term trend is significantly positive for both the Scotian Shelf (1948–2017, positive trend 0.0015 (kg/m3) per decade, significant at 1% level) and the Newfoundland Shelf (1948–2017, positive trend 0.00074 (kg/m3) per decade, significant at 1% level).

Source

Data from DFO monitoring programs (Hebert et al., 2016; Colbourne et al., 2017).

7.3.1.3

Arctic Ocean

Freshwater is accumulating in the Arctic, Canadian Arctic Archipelago, and Baffin Bay, with more freshwater present in the decade of the 2000s compared to the 1980–2000 average (Haine et al., 201556); this accumulation is particularly strong in the Beaufort Gyre. In contrast to the widespread freshening of the Arctic Ocean mixed layer, the summer southern Beaufort Sea has shown salinity increasing at a rate of approximately 2 per decade for the 1982–2012 period (Peralta-Ferriz and Woodgate, 2015113). The southern Beaufort Sea is strongly influenced by the freshwater runoff from the Mackenzie River as well as changes in the Beaufort Gyre circulation and its effects on coastal waters, and it is difficult to assess the robustness and origin of this salinity increase. Salinity has been measured at a mid-shelf site in the Beaufort Sea since 1999, but there is no discernable trend in the data collected (Steiner et al., 2015137).

In the Canadian Arctic Archipelago, salinity near the seabed at 145 m depth in the western Lancaster Sound increased over the 2002–2011 period, concurrent with warming at this location (Steiner et al., 2015137; Hamilton and Wu, 201357). For the Baffin Island Shelf, no trend in salinity can be identified in the upper 50 m layer (1950–2005), but in the 50–200 m layer there was a freshening trend (decline of 0.15 per decade) over the period 1976–2002 (Hamilton and Wu, 201357). In central Baffin Bay, there is no significant long-term trend in salinity in either the 0–50 m or the 600–800 m depth layer (Zweng and Münchow, 2006171).

7.3.2

Future projections

In the global context, the CMIP5 climate model projections suggest that subtropical regions with high sea surface salinity, dominated by net evaporation, will become more saline as the century progresses. High-latitude regions with lower sea surface salinity are projected to freshen over the coming century (Collins et al., 201320).

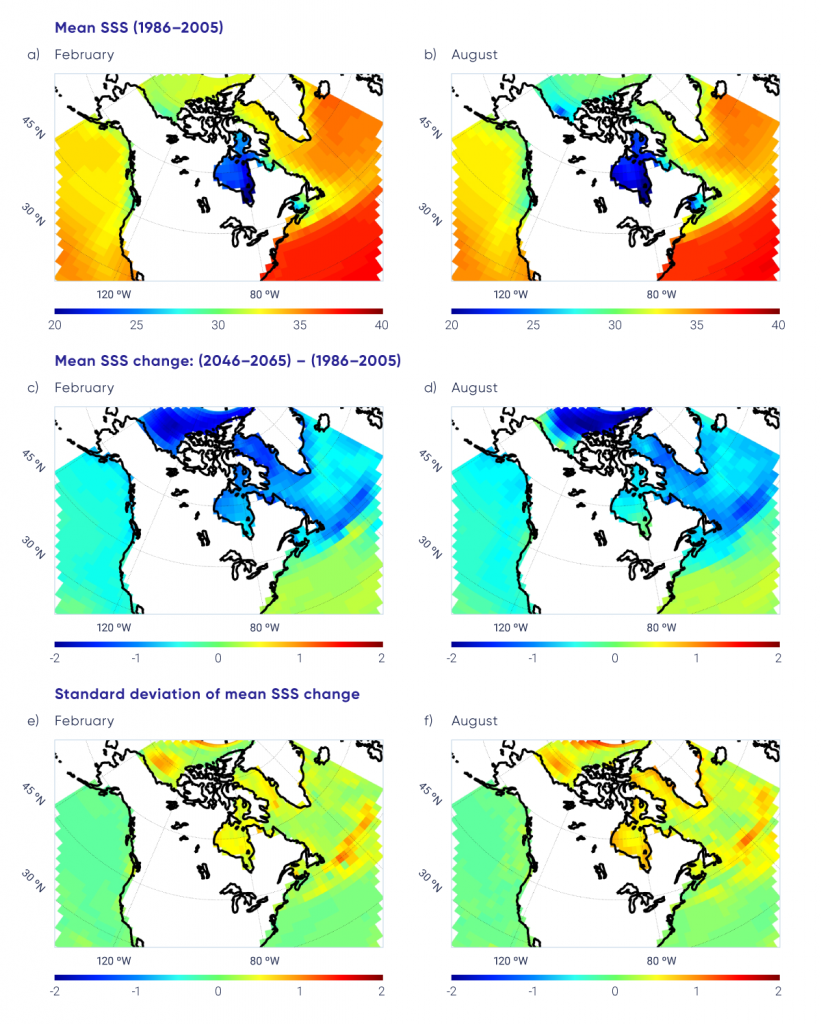
For the northeastern Pacific off Canada, future projections show significant freshening by mid-century (see Figure 7.12), with little change in the spatial structure under either a medium (RCP4.5) or high (RCP8.5) emission scenario (Christian and Foreman, 201316).

Figure-7.12

Future changes in salinity in the oceans surrounding Canada

Colour-coded maps of sea surface salinity (SSS) and projected changes in SSS in the oceans surrounding Canada. The upper two panels show model-simulated SSS for the period 1986 to 2005, for February and August. The middle row of the figure shows the change in mean SSS from the 1986 to 2005 period to mid-century under a high emission scenario for February and August. The lower two panels in the figure present the standard deviation in SSS change for the results shown in the middle panels. A general freshening of the sea surface in the Northeast Pacific and in the Northwest Atlantic north of 40° north latitude is shown. In the North Atlantic subtropical gyre, the projection indicates an increase in salinity. In the Northeast Pacific, the standard deviation is small, indicating agreement among models. In many areas of the Arctic and Northwest Atlantic Oceans, the larger standard deviation indicates larger discrepancies between model projections in these areas, where sea ice and complex ocean dynamics are important processes that are difficult to simulate.
Figure-7.12

Fifth phase of the Coupled Model Intercomparison Project (CMIP5) ensemble mean sea surface salinity (SSS) for the period 1986–2005 (top row) for February (a) and August (b). Change in the mean SSS for mid-century (2046–2065) relative to 1986–2005 for February (c) and August (d) for a high emission scenario (RCP8.5). Standard deviation in the SSS change for mid-century relative to 1986–2005 for February (e) and August (f). Panels (c) and (d) show a general freshening of the sea surface in the Northeast Pacific and in the Northwest Atlantic north of 40° north latitude (decrease generally less than 1). In the North Atlantic subtropical gyre, the projection indicates an increase in salinity (increase generally less than 1). In the Northeast Pacific, the standard deviation is small, indicating agreement among models. In many areas of the Arctic and Northwest Atlantic Oceans, the large standard deviation indicates larger discrepancies between model projections in these areas, where sea ice and complex ocean dynamics are important processes that are difficult to simulate.

Source

Adapted from Loder and van der Baaren (2013).

Significant freshening by mid-century for the subpolar Northwest Atlantic Ocean is also projected under medium (RCP4.5) and high (RCP8.5) emission scenarios (see Figure 7.12; also Loder et al., 201594). On the other hand, increased salinity is projected in the subtropical gyre, thereby increasing the difference in salinity between the two gyres of the North Atlantic Ocean. The increased difference is important, because small changes in the boundary between the gyres will result in shifts in local salinity (and, potentially, stratification and circulation). The boundary for the shift from increasing to decreasing salinity trends generally lies around 40° north latitude (Loder et al., 201594) but there are significant differences among projections for this region from different CMIP5 models; therefore, confidence in the pattern of future projections of sea surface salinity is low. A high-resolution climate model projects significantly larger changes in salinity on the ocean bottom on the continental shelf in southern Atlantic Canada, (i.e., Scotian Shelf), suggesting that the CMIP5 climate change projections for the Northwest Atlantic shelf between Cape Hatteras and the Grand Banks may underestimate expected changes in salinity (Saba et al., 2016127). The CMIP5 global models do not resolve the topography of the continental shelf or the spatial structure of the ocean overlying the shelf. CMIP5 global models also do not properly resolve the Gulf Stream separation off Cape Hatteras, North Carolina; therefore, the position of the Gulf Stream is too far north in the models’ simulations of past and present-day regional ocean climate.


Projected continued losses of sea ice will add fresh meltwater to the ocean (see Box 7.3) which, combined with projected increased precipitation (see Chapter 4, Section 4.3.1.3), will affect the freshwater input into the Arctic Ocean. The CMIP5 global model simulations project a fresher (decrease of approximately 2 by mid-century) near-surface ocean in the Beaufort Sea and area north of the Canadian Arctic Archipelago under the high emission scenario (RCP8.5) (see Figure 7.12). The spatial pattern of surface salinity shows increased freshening with distance north from the coast in the Beaufort Sea (Steiner et al., 2015137). A high-resolution model simulation for the Canadian Arctic Archipelago projects strong decadal variability in surface salinity but no clear trend by mid-century (Hu and Myers, 201470). The southward transport of freshwater that is currently tied up in sea ice in the Arctic will be a contributor to the southward extent of low-salinity water off Atlantic Canada. With less seasonal sea ice, this transport mechanism is expected to weaken and, once there is no seasonal ice cover, eventually disappear.


Section summary

In summary, there has been a slight long-term freshening of upper-ocean waters in most areas off Canada as a result of various factors related to anthropogenic climate change, in addition to natural decadal-scale variability (medium confidence). Salinity has increased below the surface in some mid-latitude areas, indicating a northward shift of saltier subtropical water (medium confidence). These statements of confidence are based on agreement among high-quality in situ observations of surface and subsurface salinity, available from DFO databases. The number of locations with long time series is more limited than those of ocean temperature, and this reduces confidence in the broader-scale representativeness of trends. Natural decadal variability is comparable in magnitude to the long-term changes in ocean salinity in most areas, which also reduces confidence in trends. Observations from the Arctic Ocean as a whole indicate freshening in most areas, but increased salinity in some others. Given the lack of data, no confidence statement has been made about climate change trends for ocean salinity in the Arctic.

Freshening of the ocean surface is projected to continue in most areas off Canada over the rest of this century under a range of emission scenarios, due to increases in precipitation and melting of land and sea ice (medium confidence). However, increases in salinity are expected in off-shelf waters south of Atlantic Canada due to the northward shift of subtropical water (medium confidence). The upper-ocean freshening and warming is expected to increase the vertical stratification of water density, which will affect ocean sequestration of greenhouse gases, dissolved oxygen levels, and marine ecosystems. These statements of confidence are based on the analysis of six CMIP5 model projections of sea surface salinity for the oceans surrounding Canada, and regional model studies. There are differences in the magnitude of salinity change among the CMIP5 model projections in the Northwest Atlantic, which means there is more uncertainty in projections for this region.

7.4

Marine winds, storms, and waves

Key Message 1

Surface wave heights and the duration of the wave season in the Canadian Arctic have increased since 1970 and are projected to continue to increase over this century as sea ice declines (high confidence). Off Canada’s east coast, areas that currently have seasonal sea ice are also anticipated to experience increased wave activity in the future, as seasonal ice duration decreases (medium confidence).

Key Message 2

A slight northward shift of storm tracks, with decreased wind speed and lower wave heights off Atlantic Canada, has been observed and is projected to continue in future (low confidence). Off the Pacific coast of Canada, wave heights have been observed to increase in winter and decrease in summer, and these trends are projected to continue in future (low confidence).

Marine storms have impacts on both the offshore economy and coastal communities. Winds are an important feature of marine storms, and waves result directly from the wind blowing over the surface of the ocean. While changes in storminess (frequency and intensity of storms) have potential negative consequences (e.g., disruption of fisheries), uncertainty in past and future global storminess remains high, as a result of poor historical observational data, inconsistencies among research studies, and differences in the projections from global and regional climate models (Hartmann et al., 201362). Because storms are dynamic, short-lived events, it is challenging to determine whether observed regional changes are a result of natural internal climate variability or attributable to anthropogenic climate change. Hence, there is lower confidence in atmospheric circulation-related projections (e.g., storminess) than in changes in thermodynamic properties such as temperature (Hartmann et al., 201362; Shepherd, 2014133).

7.4.1

Marine winds and storms

As is the case globally, the assessment of historical changes in winds and storms for the oceans surrounding Canada is hampered by limited evidence, in part related to sparse observations and challenges in integrating early marine observations, instrumental records, and satellite data. However, there is evidence of a slight northward shift of storm tracks of about 180 km over the North Atlantic Ocean (60° west to 10° east) and about 260 km for Canada as a whole (120° west to 70° west) for the 1982–2001 period relative to 1958–1977 (Wang et al., 2006152). This trend is consistent with global assessments, which have observed a poleward shift of storm tracks and the jet stream since the 1970s (Wu et al., 2012159; Hartmann et al., 201362), and is projected to continue through this century (Collins et al., 201320). The poleward shift results in a modest projected decrease in wind speed and wave heights over marine areas in Atlantic Canada (Casas-Prat et al., 201812).


An increasing trend in the frequency of autumn (October–December) extreme storms (low-pressure systems of core pressure less than 980 hPa) over the 1958–2010 period has been observed over marine areas of Atlantic Canada, but there are no statistically significant trends for extreme storms in other seasons for the Atlantic and Pacific coasts of Canada (Wang et al., 2016152). This is consistent with research that has demonstrated that human activities have contributed to an observed upward trend in North Atlantic hurricane activity since the 1970s (Kossin et al., 201785). Model projections of late-summer and autumn storms off Atlantic Canada suggest a slight northward shift of storm tracks and a modest reduction in intensities of storms, although extreme storms may have increased intensities (Jiang and Perrie, 200781, 200882; Perrie et al., 2010116; Guo et al., 201554).

For the Arctic above 75° north latitude, an increasing trend in storm frequency and intensity has been seen in all long-term datasets that cover 1958–2010 or 1900–2010 periods (see Wang et al., 2016152). This trend is independent of different storm identification and analysis methods and is consistent with the increasing trend in ocean surface wave heights in this region, as seen in satellite data (Francis et al., 201142; Liu et al., 201691) and wave reanalysis data (Wang et al., 2015155; see also Section 7.4.2). However, observations are sparse in the Arctic region, which lowers our confidence in storminess trends in this region. Increases in surface wind speed over Canadian sectors of the Arctic Ocean are projected, largely related to the projected declines in sea ice (Casas-Prat et al., 201812).

7.4.2:

Waves

Waves are an important physical feature of the ocean surface that affects fluxes of energy, heat, and gases between the atmosphere and ocean, as well as marine safety and transportation. Surface waves are generated by wind forcing, and “significant wave height” is a measure that is approximately equal to the average of the highest one-third of wave heights. Global and regional time series of wave characteristics are available from buoy data, voluntary observing ship reports, satellite measurements, and model wave reanalysis/hindcasts (i.e., simulations of past conditions using observations of other climate variables).

In the Arctic, over the 1970–2013 period, significant wave heights have increased over the Canadian Beaufort Sea westward to the northern Chukchi Sea in September, with the Beaufort–Chukchi–Siberian Seas regional mean significant wave height increasing at a rate of 3% to 8% per decade in July–September (Wang et al., 2015155). These trends suggest that increasing wave energy could constitute a mechanism to break up sea ice and accelerate ice retreat (Thomson and Rogers, 2014140; Wang et al., 2015155); however, the rate of sea ice reduction could also be enhanced by wave mixing in the upper ocean, causing an added release of heat (Smith et al., 2018134). For areas experiencing loss of sea ice (see Chapter 5, Section 5.3), significant seasonal increases in waves are projected for the future (Casas-Prat et al., 201812). Reduced sea ice cover will result in greater distances of open water for waves to travel across and, with a southward mean wave direction for the Arctic Ocean, this will result in increased wave impacts on coastal infrastructure and communities in the Canadian Arctic.

For the waters off the Pacific coast, an analysis of buoy wave records revealed that wave heights in the region off British Columbia have decreased significantly over the past three to four decades in summer and increased slightly in winter, showing small decreasing annual trends (Gemmrich et al., 201147). The same trends and trend seasonality are evident in other studies (Wang and Swail, 2001150) and are also projected to continue into the future (Wang et al., 2014154; Casas-Prat et al., 201812; Erikson et al., 201536). The wintertime increase in wave height in this region is also seen in observations from voluntary observing ships (VOS) for 1958–2002, but these results show much larger increases (Gulev and Griforieva, 200653). The reason for the difference between the VOS and other results is uncertain.

Over the past half-century, the large-scale pattern of North Atlantic wave heights is characterized by increases in the Northeast Atlantic, with decreases in the mid-latitude North Atlantic in winter (Wang and Swail, 2001150, 2002151; Wang et al., 2012153; Bromirski and Cayan, 20158). For the waters off Atlantic Canada, small increases (around 2 cm per decade) in summertime wave heights and insignificant wintertime decreases were observed for the 1948–2008 period (Bromirski and Cayan, 20158). Similar trends are also seen in other observational wave studies (Wang and Swail, 2001150, 2002151). These results differ from VOS observations for 1958–2002, which show wintertime increases of around 0.1 m per decade for the waters off Atlantic Canada (Gulev and Griforieva, 200653), and the reason for this discrepancy is unclear. Modest decreases in wave height in the region off Atlantic Canada are projected over the coming century (Wang et al., 2014154; Casas-Prat et al., 201812). In the Gulf of St. Lawrence, downscaled projections suggest decreased mean significant wave heights in summer and increased wave heights in winter, with reduced seasonal sea ice playing an important role (Long et al., 201595; Perrie et al., 2015115; Wang et al., 2018149)


Section summary

In summary, consistent significant trends in winds, storminess, and waves have not been found for most of the waters off Canada, in part due to limited data and strong effects of natural variability. Long-term data are very limited, tend to have very coarse spatial resolution, and do not cover nearshore areas. A slight northward shift of storm tracks, with decreased wind speed and lower wave heights off Atlantic Canada, has been observed and is projected to continue (low confidence). Off the Pacific coast, wave heights have been observed to increase in winter and decrease in summer, and these trends are projected to continue in future (low confidence).These confidence statements reflect the limited amount of published literature specific to winds and waves in the marine regions off Canada, the lack of high-quality historical data, and discrepancies in trends derived from different datasets.

Surface wave heights and the duration of the wave season in the Canadian Arctic have increased since 1970 and are projected to continue to increase over this century as sea ice declines (high confidence). Off Canada’s east coast, areas that currently have seasonal sea ice are also anticipated to experience increased wave activity in the future, as seasonal ice duration decreases (medium confidence). This key message is based on limited wave time series in regions with seasonal ice coverage and a few published regional studies; however, there is strong evidence of past trends and future projections of declines in sea ice in both the Arctic and Atlantic Canada (see Chapter 5, Section 5.3). Increased wave activity resulting from sea ice decline is based on modelling results and expert judgment regarding the understanding of air–sea interaction processes.

7.5

Sea level

Key Message 1

Globally, sea level has risen, and is projected to continue to rise. The projected amount of global sea-level rise in the 21st century is many tens of centimetres and it may exceed one metre. However, relative sea level in different parts of Canada is projected to rise or fall, depending on local vertical land motion. Due to land subsidence, parts of Atlantic Canada are projected to experience relative sea-level change higher than the global average during the coming century (high confidence).

Key Message 2

Where relative sea level is projected to rise (most of the Atlantic and Pacific coasts and the Beaufort coast in the Arctic), the frequency and magnitude of extreme high water-level events will increase (high confidence). This will result in increased flooding, which is expected to lead to infrastructure and ecosystem damage as well as coastline erosion, putting communities at risk. Adaptation actions need to be tailored to local projections of relative sea-level change.

Key Message 3

Extreme high water-level events are expected to become larger and occur more often in areas where, and in seasons when, there is increased open water along Canada’s Arctic and Atlantic coasts, as a result of declining sea ice cover, leading to increased wave action and larger storm surges (high confidence).

Global mean sea level is projected to rise by 28–98 cm during this century, and possibly more, due primarily to thermal expansion of the oceans and decreasing land ice (glaciers, ice caps, and ice sheets) (e.g., IPCC, 201376; Church et al., 201318). Recent publications raise the possibility of larger amounts of global sea-level rise by 2100, primarily due to enhanced delivery of Antarctic ice to the oceans (e.g., Ritz et al., 2015126; Deconto and Pollard, 201627). Sea-level rise leads to increased coastal flooding and erosion, depending on the physical nature of the coastline. Thus, projections of sea-level change are important for forecasting risk to populations, for infrastructure planning and maintenance, and for habitat management (e.g., Nicholls et al., 2011109).

Global mean sea-level change is commonly discussed in terms of “absolute” sea level, meaning that it is referenced to the centre of the Earth. At coastal locations, the sea-level change that is experienced relative to land is known as “relative” sea-level change; this can differ from absolute sea-level change because of geophysical processes that cause land to move upward (“uplift”) or downward (“subsidence”). Relative (local) sea-level projections for Canada’s coasts (James et al., 201478, 201579; Lemmen et al., 201687) based on CMIP5 and other results (Church et al., 201318) are reviewed and updated in this section.

Projections of relative sea-level change are provided for a number of Representative Concentration Pathway (RCP) scenarios as well as an enhanced scenario. The low emission scenario (RCP2.6) represents a strong mitigation pathway requiring concerted global action (Moss et al., 2010106). At present, atmospheric carbon dioxide concentrations are tracking above the low scenario (UNEP 2017146), and it is advisable to consider the risks associated with higher emission scenarios in adaptation planning.

7.5.1

Historical sea level

Globally, for most of the 20th century (up to 1990), sea level rose at a mean rate slightly larger than 1 mm/year (average [90% uncertainty range]: 1.2 [1.0 to 1.4] mm per year [Hay et al., 201564]; 1.1 [0.5 to 1.7] mm per year [Dangendorf et al., 201725]). Recently, the rate of mean sea-level rise has increased, and the rate of global mean sea-level rise after 1993 is nearly three times as large (average [90% uncertainty range]: 3.0 [2.3 to 3.7] mm per year, 1993–2010 [Hay et al., 201564]; 3.1 [0.3 to 5.9] mm per year, 1993–2012 [Dangendorf et al., 201725]).

The long-term trends in relative sea level observed at tide gauges in Canada vary substantially from one location to another. Some of the variability is due to oceanographic factors affecting the absolute elevation of the sea surface, but a major determinant of relative sea-level change in Canada is vertical land motion. Land subsidence (sinking) increases relative sea-level, while land uplift does the opposite. Across much of Canada, land uplift or subsidence is mainly due to the delayed effects of the last continental glaciation (ice age), called glacial isostatic adjustment (GIA). GIA is still causing uplift of the North American continental crust in areas close to the centre of former ice sheets, such as Hudson Bay, and subsidence in regions that were on the edge of former ice sheets, such as the southern part of Atlantic Canada, as shown in Global Positioning System (GPS) data (see Figure 7.13). On the west coast, active tectonics, and, on the Fraser delta, sediment consolidation (Mazzotti et al., 2009101), contribute to vertical land motion.

Figure-7.13

Crustal uplift and subsidence rates for the Canadian landmass

A map of Canada shows regions where the land is rising around Hudson Bay and much of the Canadian Arctic Archipelago. Regions that are sinking include the Beaufort coastline of Yukon and Northwest Territories, the Maritime provinces, and the island of Newfoundland. Most of British Columbia is rising, but not as quickly as Hudson Bay.
Figure-7.13

Rates of land uplift and subsidence determined from Global Positioning System (GPS)-derived data (in millimetres per year).

Source

Craymer and Robin, 2016.

In the Atlantic region, vertical measured land motion ranges from uplift rates of about 1–4.5 mm per year for Quebec sites to subsidence of up to about 2 mm per year at some locations in Nova Scotia (see Figure 7.13). On the west coast of Canada, vertical motion rates vary from negligible values near Vancouver to uplift of almost 4 mm per year in the middle part of Vancouver Island, and smaller rates of uplift further north. The largest variation in vertical land motion is observed in the Arctic. Hudson Bay coastlines are rising at a rate of 10 mm per year or more. Significant portions of the Canadian Arctic Archipelago coastline are uplifting at a rate of a few millimetres per year from a combination of GIA and the response of Earth’s crust to present-day changes in ice mass, whereas the Beaufort Sea coastline in the western Arctic is subsiding due to GIA at a rate of 1–2 mm per year.

The effects of vertical land motion are evident in tide gauge records (see Figure 7.14). Where the land is uplifting rapidly due to GIA, such as at Churchill, Manitoba (on Hudson Bay), sea level has been falling rapidly, at a rate of 9.3 mm per year. Where the land is sinking due to GIA, such as much of the Maritimes, southern Newfoundland, and along the Beaufort Sea coast of the Northwest Territories and Yukon, sea level is rising faster than the global average. At Halifax, sea level rose at a rate of about 3.3 mm per year during the 20th century.

Figure-7.14

Long-term trends of relative sea-level change at representative sites across Canada

The water-level records of nine tide gauges distributed around Canada are shown. The records show substantial variability from year to year, indicating the changing nature of the oceans and the influence of climate cycles and other processes. For the west coast, the 1997/98 ENSO event is apparent as a time of high water levels during the winter months. The records illustrate different rates of long-term sea-level change, ranging from sea-level fall of over 9 mm per year at Churchill, Manitoba, on Hudson Bay, to sea-level rise of 2.5 mm per year at Tuktoyaktuk, Nunavut, and 3.3 mm per year at Halifax, Nova Scotia. Other locations feature smaller rates of sea-level fall (Alert, Nunavut, 1.5 mm per year; Tofino, British Columbia, 0.9 mm per year) and rise (Vancouver, British Columbia, 0.9 mm per year; Rimouski, Quebec, 0.6 mm per year; Prince Rupert, British Columbia, 1.4 mm per year, and St. John’s, Newfoundland and Labrador, 1.9 mm per year).
Figure-7.14

The water-level records (monthly values, with tides removed) of nine tide gauges distributed around Canada. The records show differing linear trends from one location to another, primarily indicating different amounts of vertical land motion arising from glacial isostatic adjustment and other factors. Superposed on this long-term change is substantial variability from year to year, indicating the changing nature of the oceans and the influence of climate cycles and other processes. For the west coast, the 1997/98 El Niño–Southern Oscillation event (ENSO, indicated by arrows) was a time of high water levels during the winter months. Individual tide gauge records are vertically offset for display purposes.

Source

Tide gauge data obtained from the Permanent Service for Mean Sea Level at <http://www.psmsl.org/data/obtaining> and accessed 19 September 2017.

7.5.2

Future projections

Projections of relative sea-level changes for coastal Canada, based on the CMIP5 model projections used in IPCC AR5 (Church et al., 201318), take into account projections of global sea-level change, vertical land motion, dynamic oceanographic changes, and redistribution of meltwater from glaciers, ice caps, and ice sheets in the oceans (James et al., 201478, 201579; Han et al., 2015b60, 2015c61; Zhai et al., 2015169; Lemmen et al., 201687). The following gives a brief description of the factors contributing to sea-level change.

7.5.2.1

Global sea-level rise

Global (absolute) sea-level change results from a variety of sources: thermal expansion of warming ocean waters; addition of water from mountain glaciers, ice caps, and the Greenland and Antarctic ice sheets; and human activities that directly contribute to sea-level rise (i.e., groundwater depletion) and to sea-level fall (from water impoundment behind newly built dams).

Global (absolute) mean sea level is projected, in IPCC AR5, to rise by 28 to 98 cm by 2100, relative to 1986–2005 (Church et al., 201318; see Figure 7.15), depending on the emission scenario. But global mean sea-level rise could exceed 1 m by 2100 if additional contributions of water come from the marine-based sectors of the Antarctic Ice Sheet (Church et al., 201318). There is a potential for collapse of parts of the ice sheet that are in direct contact with warming ocean waters, through ice shelves extending out into the ocean. There is medium confidence that this additional contribution would not exceed several tenths of a metre of sea-level rise during the 21st century (Church et al., 201318). Most recent modelling findings are consistent with the IPCC AR5 assessment (Cornford et al., 201521; Golledge et al., 201551; Joughin et al., 201483; Levermann et al., 201488; Ritz et al., 2015126). An exception is a modelling study (DeConto and Pollard, 201627) that projects up to a metre or more of sea-level rise from Antarctica alone for a high emission scenario (RCP8.5) by 2100. These larger amounts of global sea-level rise would have significant impacts on coastal populations.

Figure-7.15

Projected global sea-level rise during the 21st century

Projected global sea-level rise is given for the low emission (RCP2.6) and high emission (RCP8.5) scenarios through the 21st century. As well, an enhanced scenario reflecting increased discharge of ice from Antarctica is shown at 2100. The low scenario shows the average (median) sea-level rising to nearly 45 cm by 2100, relative to the starting time of 1995, while the high scenario shows global sea level rising to nearly 75 cm. Both projections are accompanied by envelopes indicating the range of uncertainty, with the low scenario ranging from less than 30 cm to more than 60 cm at 2100, while the high scenario ranges from more than 50 cm to nearly 1 m of sea-level rise by 2100. The enhanced scenario gives 139 cm of sea-level rise at 2100. The average sea-level rise for the time period 2081–2100 is also given, with the low scenario showing 40 cm of sea-level rise, the medium scenario showing 47 cm of sea-level rise, and the high scenario showing 63 cm of sea-level rise. Above the enhanced scenario, an arrow extends upwards to the upper limit of the figure at 200 cm, indicating that larger amounts of global sea-level rise by 2100 cannot be ruled out.
Figure-7.15

Projections of global average (mean) sea-level rise relative to 1986–2005 for low (RCP2.6) and high (RCP8.5) emission scenarios from IPCC AR5 (Church et al., 2013). Also shown is an enhanced scenario reflecting greater amounts of ice discharged from Antarctica and contributing to global sea-level rise (see Table 7.1). The lines indicate the median projection, and the shading indicates the assessed range (5th–95th percentile, or 90% uncertainty range). The projected global mean sea-level rise over 2081–2100 (relative to 1986-2005) is given on the right for these scenarios and for a medium emission scenario (RCP4.5). Lines and shading are the same as in the main graph.

Source

Figure SPM.9, IPCC, 2013.

Global sea-level change scenarios used to generate relative sea-level projections across Canada are reported in Table 7.1 for low [RCP2.6], medium [RCP4.5], and high [RCP8.5] emission scenarios and an enhanced high scenario. The enhanced high scenario specifically evaluates the effect of more rapid drawdown of portions of the West Antarctic Ice Sheet on relative sea-level change in Canada. The enhanced scenario was created by augmenting the high emission scenario (RCP8.5), the scenario most likely to be associated with rapid ice-sheet discharge, by an additional 65 cm of sea-level rise3 originating from West Antarctica. This scenario, with a total global sea-level rise of 139 cm by 2100, lies above most recent Antarctic modelling results and within the range of the results of the recent study of DeConto and Pollard (2016)27. It is a plausible extreme scenario, but even larger amounts of global sea-level rise cannot be ruled out.

Table 7.1

Projected global sea-level rise by 2100

Emission scenario Likely global sea-level rise by 2100 (cm), median [90% uncertainty range]1
Low (RCP2.6) 44 [28 to 61]
Medium (RCP4.5) 53 [36 to 71]
High (RCP8.5) 74 [52 to 98]
Enhanced; RCP8.5 plus Antarctic Ice Sheet reduction2 74 + 65 = 139
1Relative to 1986–2005.

2Scenario is indicative, so percentile values (uncertainty range) are not provided.

The potential impacts of extreme sea-level rise on human settlement, economic activity, and coastal ecosystems are substantial and would pose great challenges to adaptation (e.g., Parris et al., 2012, 112; Mercer Clarke et al., 2016 102). It may be appropriate to consider even larger global sea-level rise scenarios, given the large uncertainties regarding the stability of the marine sectors of the Antarctic Ice Sheet. The US National Climate Assessment considers an “extreme” scenario of 2.5 m of global sea-level rise by 2100 that is intended to “test plans and policies against extreme cases with a low probability of occurrence but severe consequences if realized” (Sweet et al., 2017138).

7.5.2.2

Vertical land motion

As discussed in Section 7.5.1, vertical land motion strongly influences changes in relative sea level (Figure 7.13). Vertical land motion due to GIA will continue at rates close to rates currently observed.

7.5.2.3

Other effects

Meltwater from glaciers, ice caps, and ice sheets is not distributed uniformly throughout the world’s oceans (Farrell and Clark, 197637; Mitrovica et al., 2001104, 2011103), because the Earth’s crust responds elastically to ice-mass changes and ocean water is subjected to reduced gravitational attraction of any nearby shrinking ice mass. These effects are incorporated into calculations of meltwater redistribution to determine relative sea-level change.

Global ocean currents are associated with spatial variations in “dynamic” sea surface topography of up to 1 m in amplitude (i.e., about 2 m from peak to trough). Changes to ocean currents can lead to changes in both absolute and relative sea level. Enhanced sea-level rise due to reductions in the Atlantic Meridional Overturning Circulation (see Section 7.1) projected in CMIP5 models is expected for northeastern coastal North America, including Atlantic Canada, in the coming century (Yin et al., 2010167; Yin, 2012166; Church et al., 201318).

7.5.2.4

Projections of relative sea-level change

Relative sea-level projections for coastal communities and other locations in Canada, incorporating the factors described above (see also Han et al., 2015b60), show the effect of global sea-level rise as well as differences from one area to another due to vertical land motion (James et al., 201478; see Figure 7.16).4 The projected sea-level changes generally differ from one area to another in a similar way to historical relative sea-level change measured at tide gauges (see Figure 7.14).

Figure-7.16

Projected relative sea-level change along Canadian coastlines at the end of the century

A map of Canada shows the projected relative sea-level change for nearly 70 coastal locations across Canada and in the adjacent continental United States for the high emission scenario. The values are for the median projection of the high scenario at 2100, relative to the 1986–2005 period. The largest projected sea-level rise is 75 to 93 cm in Atlantic Canada. The largest projected sea-level fall is 75 to 84 cm in Hudson Bay and the Canadian Arctic Archipelago, including the northernmost point of Alert. Intermediate values of sea-level rise of 25 to 75 cm are shown for points in British Columbia, Quebec, and the Beaufort coastline. For comparison, the projected median global sea-level change by 2100 for the high emission scenario is 74 cm.
Figure-7.16

Projected relative sea-level changes shown at 2100 for the median of a high emission scenario (RCP8.5) at 69 coastal locations in Canada and the northern United States. Values range from a sea-level fall of 84 cm to a sea-level rise of 93 cm and are relative to the average conditions in the 1986–2005 period. For comparison, the projected median global sea-level change at 2100 for the high emission scenario is 74 cm.

Source

James et al. (2014, 2015); Lemmen et al (2016).

The largest projected sea-level rise, exceeding 75 cm for the median projection of the high emission scenario by 2100 (red dots on Figure 7.16), is projected where the land is currently sinking due to GIA in Atlantic Canada (see Figure 7.13). Other areas where the land is also sinking or uplifting at low rates due to GIA, with projected sea-level rise larger than 50 cm (orange dots on Figure 7.16), include the Beaufort Sea coastline, parts of southern Newfoundland and Quebec, and the Fraser River lowland and northern British Columbia. Where the land is currently uplifting fastest, in Hudson Bay and the central Canadian Arctic Archipelago, sea level is projected to continue to fall by more than 50 cm by 2100 (dark blue and purple dots on Figure 7.16). In the high Arctic and eastern Arctic, the effects of present-day ice-mass changes (due to loss of Arctic glaciers and ice caps, and the Greenland Ice Sheet) contribute to reduced projected sea-level rise or small sea-level fall (see Section 7.5.2.3).

Figure 7.17 summarizes the sea-level projections for all scenarios for Halifax, Nova Scotia; Vancouver, British Columbia; Nain, Newfoundland and Labrador; and La Grande 1, Quebec. These locations span a range of vertical crustal motion, from sinking at about 1 mm per year (Halifax) to uplifting rapidly at 15 mm per year (La Grande 1). The enhanced high scenario (green triangle) is notable in providing projections of relative sea-level change exceeding 150 cm at Halifax by 2100 and only negligible sea-level fall at the fastest land-uplifting location of La Grande 1. In contrast, the low emission scenario (RCP2.6) anticipates about 50 cm of sea-level rise at Halifax and more than 100 cm of sea-level fall at La Grande 1. Further details on the regional variability of projected sea-level changes are presented in Lemmen et al. (201687; see Chapter 2 of that report for an overview, and regional Chapters 4, 5, and 6 of that report).

Figure-7.17

Projected relative sea-level change for representative coastal locations across Canada

Projected relative sea-level change is shown for four locations across Canada by the end of the 21st century. The four locations span a range of crustal motion, with Halifax (in Atlantic Canada) sinking at about 1 mm per year, Vancouver (British Columbia) showing no vertical crustal motion, Nain (in Labrador) rising at about 4.5 mm per year, and La Grande 1 (in Quebec near James Bay) rising at 15 mm per year. Projections are shown for the low, intermediate, and high scenarios and also for the enhanced scenario, which is the high emission scenario plus an additional 65 cm of sea-level rise from Antarctica. The site that is sinking (Halifax) shows the largest sea-level rise projections of about 50 to 100 cm for the low, intermediate, and high emission scenarios. The site that is rising the fastest (La Grande 1) shows projected sea-level fall of about 75 to 110 cm. The location with no vertical crustal motion (Vancouver) has a projected sea-level increase of 40 to 60 cm, and the site that is rising moderately quickly (Nain) has projected relative sea-level ranging from a fall of 20 cm to a rise of 10 cm. The enhanced scenario is notable for featuring about 165 cm of sea-level rise for Halifax, 140 cm for Vancouver, 135 cm for Nain, and a sea-level fall of 10 cm at La Grande 1.
Figure-7.17

Projected relative sea-level change based on global sea-level projections from Church et al. (2013), and vertical (V) crustal motion (uplift rate, given to nearest 0.5 mm per year) derived from Global Positioning System (GPS) observations indicated in each panel for (a) Halifax, (b) Vancouver, (c) Nain, and (d) La Grande 1 (James et al., 2014, 2015; Lemmen et al., 2016). Projections are given through the current century for low emission (RCP2.6), medium emission (RCP4.5), and high emission (RCP8.5) scenarios. The projected value by 2100 is also given for the enhanced scenario (RCP8.5 plus 65 cm reflecting Antarctic Ice Sheet (AIS) reduction; green triangle). Rectangles show the 90% uncertainty range (5th–95th percentile) of the average projection over the 2081–2100 period and also include the medium (RCP6.0) emission scenario; the dashed red line shows the 95th percentile value for the high emission scenario.

Source

James et al. (2014, 2015), Lemmen et al. (2016).

Global sea level will continue to rise for centuries beyond 2100, with rates dependent on future greenhouse gas emissions and the potential melting of the Greenland and West Antarctic ice sheets (Church et al., 201318; Atkinson et al., 20162). The general spatial patterns of projected relative sea-level change in Canada beyond 2100 are expected to be similar to those for the current century. Relative sea-level rise at rates above the global average is expected in areas where land is sinking, sea-level fall is expected to continue (but at reduced rates) in areas where land is uplifting relatively quickly, and there could be a change from falling to rising sea level in some areas.

7.5.3

Extreme water levels

Ocean-surface heights vary on timescales from seconds to hours to years, due to waves, tides, and atmospheric and ocean circulation. These fluctuations may arise from the large-scale modes of internal climate variability (ENSO, Pacific Decadal Oscillation, and North Atlantic Oscillation events; see Chapter 2, Box 2.5), seasonal warming and runoff, storms, and changes to ocean circulation. Extreme ENSO events can result in coastal sea-level changes of a few tens of centimetres (see Figure 7.14; see the high-water levels at the British Columbia sites at the end of 1997 and beginning of 1998). The ENSO cycle may intensify with global warming (Cai et al., 201410), and this could generate larger peak water levels during El Niño events on Canada’s west coast. Together, these factors, superimposed on the tidal cycle, produce variability that causes peak water levels to vary substantially throughout the year, and from year to year.

One of the most serious consequences of sea-level rise is its effect on extreme high coastal water-level and flooding events. These events are typically associated with storm surges that coincide with high tides (see Box 7.5). Storm surges can have heights of 1 m or more above high tide levels (Bernier and Thompson, 20065; Han et al., 201259; Ma et al., 201598; Manson and Solomon, 200799; Thomson et al., 2008141), with wave run-up further adding to the extent of flooding. Where relative sea level is projected to rise, extreme high water levels (combined tide and surge) are expected to be even higher and more frequent in the future.

The effect of sea-level rise on extreme water levels is illustrated for Halifax (see Figure 7.19). Sea-level has been rising at Halifax, and the number of water levels exceeding the 2.3 m flood level (red line in Figure 7.19) has increased through the 20th and early 21st century. The record shows that, for this particular flood level, 131 flooding events have occurred in the historical record (1901–2018), while for a 2.1 m flood level (magenta line) there have been 596 flooding events, which is more than four times as many. A 20 cm rise in mean sea level, which is projected to occur within two to three decades at Halifax for all emission scenarios (Figure 7.17), can therefore be anticipated to increase 2.3 m flooding events at this location by about the same factor of four. Generally, a projected rise in mean sea level is expected to increase the number of extreme water-level events at a given flood level as well as increase the largest flood height (Church et al., 201318). For example, large, impactful events, such as the water level reached once every 50 years at Halifax in the past, may occur as frequently as every two years by mid-century under the relative sea-level rise caused by a high emission scenario (Atkinson et al., 20162).

Figure-7.19

Halifax Harbour tide gauge record and extreme water levels

The tide gauge record of hourly water levels is displayed for Halifax Harbour for 1920 to 2018. The detailed record shows that water levels reach extreme levels from time to time, a consequence of storm surges and other natural variability. The mean sea-level curve shows short-term variability, but it has been rising throughout the record duration. Flood levels at 2.3 m and 2.1 m show increasing numbers of extreme water-level events throughout the record duration, a consequence of the rise in mean sea level. The number of events at the lower 2.1 m flood level (596) is much higher than at the higher 2.3 m flood level (131).
Figure-7.19

Hourly water levels recorded at Halifax Harbour for 1920 to 2018, with 5% extremes shown in dark blue and the 90% mid-range in light blue. Mean sea level (thick blue line) exhibits short-term variability superposed on a long-term increase throughout the record duration. Flood levels at 2.3 m (red line) and 2.1 m (aqua line) show increasing numbers of extreme water-level events throughout the record duration, a consequence of the rise in mean sea level. The number of events at the lower 2.1 m flood level (596) is much higher than at the higher 2.3 m level (131).

Source

Canadian Hydrographic Service, Fisheries and Oceans Canada.

Increases in storm frequency or intensity would contribute to further increases in the occurrence of extreme high water-level events; however, projecting such increases is difficult because region-specific projections of storminess are not robust (Hartmann et al., 201362; see Section 7.4.1). While more thermal energy in a warmer atmosphere is projected to lead to increased storminess on a global scale, storminess may or may not increase in any given region, depending on storm-source regions and storm tracks. Projections of changes to wave height in the oceans surrounding Canada are also uncertain (see Section 7.4.2), but where winds and wind-driven waves increase, wave set-up and run-up (the maximum level waves reach) will also increase (see Box 7.5). Larger waves generally have greater erosive power and damage potential.

Reductions in sea ice cover (see Chapter 5, Section 5.3) also have important implications for wind-driven waves (see Section 7.4.2), storm surges, and extreme high water levels. Sea ice in the nearshore prevents waves from breaking directly onshore and reduces wave run-up (Forbes and Taylor, 199441; Allard et al., 19981). Ice further offshore reflects waves and reduces their height before they reach the shoreline (Wadhams et al., 1988148; Squire, 2007136). A greater amount of open water leads to larger waves, even if the winds are unchanged (e.g., Lintern et al., 201190). Increased winds over open water and higher waves, arising from reduced sea ice that would otherwise diminish storm surges, lead to higher extreme water levels. Thus, in areas where sea ice is projected to continue to diminish, such as Atlantic Canada in winter and spring (Han et al., 2015a58) and the Arctic in summer and fall, there is the potential for increased extreme high water levels due to stronger storm surges and wave run-up.


Section summary

In summary, global mean sea level has risen globally and is projected to continue to rise by many tens of centimetres, possibly exceeding a metre, by 2100. This is primarily attributable to ocean thermal expansion and water delivered to the oceans from diminishing glaciers and ice sheets. Across Canada, however, relative sea level is projected to rise or fall, depending on the amount of global sea-level rise and local vertical land motion. Due to post-glacial land subsidence, parts of Atlantic Canada are projected to experience relative sea-level change higher than the global average during the upcoming century (high confidence). This statement of confidence is based on a strong mechanistic understanding of processes controlling global and relative sea levels. Uncertainty remains about the magnitude of some sources of global sea-level, especially the projected amount of water delivered by the Antarctic Ice Sheet. All emission scenarios are projected to result in global mean sea-level rise, with the magnitude of change diverging among scenarios in the latter half of the 21st century. Vertical land motion measurements are consistent over broad spatial scales, which contribute to the confidence in the relative sea-level projections. Adaptation actions need to be tailored to local projections of relative sea-level change.

Where relative sea level is projected to rise (most of the Atlantic and Pacific coasts and the Beaufort coast in the Arctic), the frequency and magnitude of extreme high water-level events will increase (high confidence). This will result in increased flooding, which is expected to lead to infrastructure and ecosystem damage as well as coastline erosion, putting communities at risk. The statement of confidence is based on long-term measurements of coastal sea level and mechanistic understanding of the processes controlling extreme water-level events. Where relative sea level is projected to rise, extreme high water levels (combined tide and surge) will be even higher and more frequent in the future. As yet, projections of regional storm intensity and frequency are not robust, so their potential contribution to changes in extreme water-level events is uncertain.

Extreme high water-level events are expected to become larger and occur more often in areas where, and in seasons when, there is increased open water along Canada’s Arctic and Atlantic coasts, as a result of declining sea ice cover, leading to increased wave action and larger storm surges (high confidence). The statement of confidence is based on a mechanistic understanding of the processes controlling extreme water-level events and expert judgment. This finding is supported by Chapter 5, which demonstrates significant declines in summer sea ice area observed across the Canadian Arctic, while winter sea ice area is decreasing in eastern Canada (e.g., Gulf of St. Lawrence). Sea ice is projected to continue to decline in the Canadian Arctic, and further reductions of seasonal sea ice are projected for eastern Canada (Chapter 5, Section 5.3.2).

7.6

Ocean chemistry

Key Message 1

Increasing acidity (decreasing pH) of the upper-ocean waters surrounding Canada has been observed, consistent with increased carbon dioxide uptake from the atmosphere (high confidence). This trend is expected to continue, with acidification occurring most rapidly in the Arctic Ocean (high confidence).

Key Message 2

Subsurface oxygen concentrations have decreased in the Northeast Pacific and Northwest Atlantic oceans off Canada (high confidence). Increased upper-ocean temperature and density stratification associated with anthropogenic climate change have contributed to this decrease (medium confidence). Low subsurface oxygen conditions will become more widespread and detrimental to marine life in future, as a result of continuing climate change (medium confidence).

Key Message 3

Nutrient supply to the ocean-surface layer has generally decreased in the North Pacific Ocean, consistent with increasing upper-ocean stratification (medium confidence). No consistent pattern of nutrient change has been observed for the Northwest Atlantic Ocean off Canada. There are no long-term nutrient data available for the Canadian Arctic.
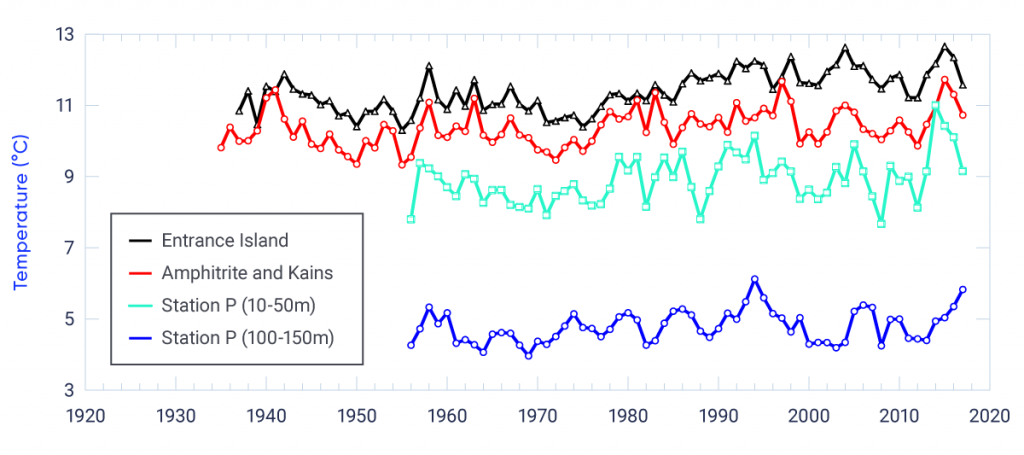
While there are a broad range of ocean chemistry topics related to climate variability and change, this section focuses on ocean acidification, dissolved oxygen levels, and nutrients. Ocean acidification is strongly linked to uptake of CO2 from the atmosphere and its sequestration in the ocean. Uptake and sequestration are strongly influenced by the physical processes within the ocean, including vertical mixing (upward and downward movement of water) and deep convection, which result in ocean ventilation (the injection of surface waters into the ocean interior and export away from their sources). Changes in oxygen concentrations in the ocean are linked to climate change through increasing upper-ocean temperature and density stratification, which also affect nutrient availability. Modification of ocean chemistry as a result of climate change has significant impacts on the marine ecosystem, and some changes could cause positive feedbacks, amplifying atmospheric CO2 concentrations.

7.6.1

Ocean acidification

An increasing concentration of CO2 in the atmosphere is not only contributing to greenhouse warming of the global climate system, it is also affecting the ocean carbon cycle (see Box 7.6) and changing the fundamental chemistry of the ocean. The ocean has taken up more than a quarter of the CO2 produced by human activities, mainly from fossil fuel burning, since the start of the Industrial Era (Sabine et al., 2004128; Rhein et al., 2013124; Jewett and Romanou, 201780). While this uptake has helped to slow the rate of anthropogenic climate change, it has also resulted in increased acidity of the ocean (referred to as ocean acidification).

Acidification takes place after CO2 gas from the atmosphere is transferred into the surface of the ocean, where it dissolves and forms carbonic acid. This process causes a decrease in pH and in the concentration of carbonate ions (CO32-), a building block of organisms with calcium carbonate (CaCO3) shells and skeletons. This process also results in a decrease in the ocean’s saturation state (a measure of the thermodynamic potential for a particular mineral to form in a solid state or to be dissolved) with respect to CaCO3. These changes can result in seawater having a corrosive effect on shells and skeletons, dissolving them, inhibiting their growth, or causing them to require more energy to grow. Ocean acidification may have many other harmful effects for marine organisms, including increased mortality of young, changes in behaviour, food web changes, reduction in suitable habitat for some species, and increases in harmful algal blooms (Haigh et al., 201555).

Observations confirm that pH, a measure of acidity, has a present-day range of 7.95–8.35 (mean 8.11) in the surface waters of the open ocean (Feely et al., 200938). Globally, the pH5of ocean surface waters has decreased by 0.1 since the beginning of the Industrial Era (Rhein et al., 2013124). The largest reduction has occurred in the northern North Atlantic, and the smallest reduction, in the subtropical South Pacific (Sabine et al., 2004128). Oceans have not experienced pH changes this rapid for at least the last 66 million years and possibly the last 300 million years (Hönisch et al., 201269). Some acidification events in Earth’s history have led to some species becoming extinct and others recovering slowly (Hönisch et al., 201269). This raises serious concerns about the resilience of marine ecosystems to increasing atmospheric CO2.

Nearshore and coastal waters are affected by the same processes as open-ocean waters and are additionally affected by freshwater inputs from rivers, glacial meltwater, and sea ice melt that decrease the capacity of coastal waters to buffer CO2, making them more vulnerable to acidification (Ianson et al., 201674; Moore-Maley et al., 2016105; Azetsu-Scott et al., 20144). Another factor in some coastal areas is nutrient inputs from human and industrial activities via rivers, and other runoff, which increase primary production in coastal waters. In turn, various forms of planktonic organisms and their decay products are consumed by bacteria that contribute to local ocean acidification and reduced oxygen concentrations (see Section 7.6.2) through bacterial respiration, which produces CO2.

Each of Canada’s marine regions (Pacific, Arctic, and Atlantic) has distinct factors that affect the degree of ocean acidification, and these regions are interconnected through ocean circulation patterns (see Section 7.1). Levels of dissolved carbon in the Northeast Pacific are naturally high due to the global ocean’s meridional overturning circulation patterns (Feely et al. 200839). In this region, water below the winter mixed layer has been travelling through the ocean interior for years to decades (out of contact with the atmosphere), accumulating additional organic matter from sinking biological production that decomposes to nutrients and CO2 (Feely et al., 200440). Summer upwelling there brings this nutrient- and CO2-rich water to the surface and causes intermittent periods of exceptionally low pH (7.6) at ocean depths above 100 m (Ianson et al., 200373, 200975; Haigh et al., 201555). These processes make for a system with considerable variability over time and space. The key issue for ocean acidification in this region is that the upwelled waters will have increasingly more CO2 and lower pH in the future (Feely et al., 200839).

The Canadian Arctic Archipelago (Chierici and Fransson, 200915) and Canada Basin of the Arctic Ocean (Yamamoto-Kawai et al., 2009160) are the first ocean regions off Canada to show low saturation state; that is, corrosive surface waters. The observed increase in acidity resulting from global CO2 emissions has been augmented in the Arctic Ocean by rapid increases in freshwater input from accelerated ice melt and increased river input, which has reduced the CaCO3 saturation state. In addition, in cold Arctic waters, CaCO3 shells are even more soluble, making shelled organisms especially vulnerable to the effects of acidification. Rapid changes are projected to continue for the Arctic Ocean surrounding Canada, and this region is expected to be the first to experience undersaturation of surface waters (Feely et al., 200938).

In the central Labrador Sea, deep convection during wintertime transports anthropogenic CO2 as deep as 2300 m (Azetsu-Scott et al., 20103). Annual sampling of the Labrador Sea since 1996 has shown a steady decline of pH (of 0.029 per decade) in a layer 150–500 m below the ocean surface, which is ventilated every year by vertical mixing during winter (see Figure 7.21). Further south, the pH of the bottom waters in the Lower St. Lawrence Estuary (in the Gulf of St. Lawrence; see Figure 7.4), have decreased by 0.2 to 0.3 since the 1930s (rate of 0.021 per decade; see Figure 7.21), which is greater than can be attributed solely to the uptake of anthropogenic CO2 (Mucci et al., 2011107). The pH decrease has been accompanied by a decline in the CaCO3 saturation state.

Figure-7.21

pH time series for the waters off Atlantic Canada

Three time series of pH in the Atlantic Ocean off Canada. pH (depth-averaged) times series over the Scotian Shelf (1933–2014, declining trend of 0.026 per decade; 1995–2014, declining trend of 0.044 per decade); near-bottom estimate (approximately 300 m) of pH in the Gulf of St. Lawrence (1935–2007, declining trend of 0.021 per decade; 1990–2007, declining trend of 0.026 per decade); and pH from the central Labrador Sea in the annually ventilated layer (150–300 m) (1996–2016, declining trend of 0.029 per decade). Estimates of pH before the 1990s have a high level of uncertainty because of the quality of the measurements and should be interpreted with caution. Therefore, no assessment of statistical confidence is provided for the observed trends.
Figure-7.21

pH (depth-averaged) time series over the Scotian Shelf (1933–2014, declining trend of 0.026 per decade; 1995–2014, declining trend of 0.044 per decade); near-bottom estimate (approximately 300 m) of pH in the Gulf of St. Lawrence (1935–2007, declining trend of 0.021 per decade; 1990-2007, declining trend of 0.026 per decade); and pH from the central Labrador Sea in the annually ventilated layer (150–300 m) (1996–2016, declining trend of 0.029 per decade). Estimates of pH before the 1990s have a high level of uncertainty because of the quality of the measurements and should be interpreted with caution. Therefore, no assessment of statistical confidence is provided for the observed trends.

Source

Data for the Scotian Shelf and Labrador Sea from the DFO monitoring database. Data for the Gulf of St. Lawrence derived from Mucci et al. (2011).

Waters of the Scotian Shelf have the lowest saturation states of the entire New England/Nova Scotia region (except for episodic nearshore events), due to cold water temperatures in the winter (Gledhill et al., 201550). As in other regions, the saturation state is modified by seasonal biological processes (Shadwick et al., 2011132). A summary of the long-term trend from upper-ocean samples collected over the Scotian Shelf and Slope indicates that pH is declining at a rate of 0.026 per decade; however, there is a high level of uncertainty in data collected before the 1990s (before the establishment of international protocols and standards) (Dickson et al., 200730). For the 1995–2014 period, the trend on the Scotian Shelf is pH declining at a rate of 0.044 per decade (see Figure 7.21).

The circulation patterns connecting Canada’s ocean regions are also important for understanding differences in acidity (see Section 7.1). The naturally high levels of dissolved carbon in waters of the Northeast Pacific result in water entering the western Arctic Ocean (through Bering Strait) with low saturation states. The saturation state of the Pacific Ocean water is further decreased through the addition of sea ice meltwater and river input, as well as respiration of organic matter, in the Arctic Ocean. Outflow through the Canadian Arctic Archipelago in the eastern Arctic can be traced along western Baffin Bay and Davis Strait to the northwestern Atlantic Ocean. While local mixing in the northern Labrador Sea modifies this Arctic outflow, low saturation states can still be identified over the Labrador/Newfoundland Shelf (Azestu-Scott et al., 20103; Yamamoto-Kawai, 2009160). Within the Atlantic region, seasonally varying outflows from the Gulf of St. Lawrence and the Labrador/Newfoundland Shelf regions bring fresher and cooler water onto the Scotian Shelf and the Gulf of Maine, which seasonally increases ocean acidification.

Under all future emission scenarios for the 21st century, global ocean acidification is expected to continue to increase in the upper ocean, with pH expected to stabilize and remain above saturation under the low emission scenario (RCP2.6) (Bopp et al., 20136). The high emission scenario (RCP8.5) would result in the Arctic surface waters becoming undersaturated by mid-century.

7.6.2

Dissolved oxygen and hypoxia

The oxygen content of the ocean is important because it constrains biological productivity, biodiversity, and biogeochemical cycles (Breitburg et al., 20187). Waters with low levels of oxygen are described as “hypoxic” (dissolved oxygen concentration of less than 61 μmol/kg) while those that are devoid of oxygen are described as “anoxic” (zero dissolved oxygen concentration). As the global ocean warms under anthropogenic climate change, a loss of dissolved oxygen is expected (Gruber, 201152). The reason for this in the open ocean is twofold. First, as ocean temperature increases, the solubility of oxygen decreases, and therefore the ocean’s capacity to hold oxygen decreases. Second, increased upper-ocean stratification caused by warming and freshening of surface water (see Box 7.4) tends to reduce vertical mixing and ventilation of the main thermocline (an ocean layer where water temperature changes rapidly with depth), resulting in a decreased supply of oxygen from its surface to subsurface waters. The global ocean has lost about 2% of its oxygen since 1960, with large variations among ocean basins and at various depths (Schmidtko et al., 2017130). For the upper ocean, over the 1958–2015 period, trends in oxygen concentration and ocean heat content are highly correlated (Ito et al., 201777).

There is only qualitative agreement between computer models and observations with regard to the amount of oxygen loss in the surface of the ocean. CMIP5 models consistently simulate a decline in the global dissolved oxygen inventory equal to only about half of the observation-based estimates and also predict different spatial patterns of oxygen change (Schmidtko et al., 2017130; Bopp et al., 20136; Oschlies et al., 2008110). This suggests that mechanisms of oxygen decline are not well represented in current ocean models.

Human activities can play a major role in changes in dissolved oxygen in coastal waters, which can be exacerbated by the impacts of anthropogenic climate change. Coastal and inland waters are particularly vulnerable to decreasing oxygen trends (Gilbert et al., 201048), because eutrophication (an increase in the rate of supply of organic matter to an ecosystem) is generally higher in these areas and because physical flushing may not be adequate to disperse oxygen-depleted waters. It can be difficult to separate the effects of nutrient enrichment and climate change in assessing changes in oxygen concentration in these waters. A general overview of oxygen status and trends in Canadian marine waters is provided in Figure 7.22.

Figure-7.22

Oxygen status and trends in marine regions surrounding Canada

Map of Canada with descriptions of trends in oxygen for marine regions surrounding Canada. For each region, the region name, dissolved oxygen (DO) status, and trend are given: Gulf of Alaska, hypoxia at mid-depth, decreasing DO trend; Strait of Georgia, episodic hypoxia at bottom, decreasing DO trend; British Columbia fjords, hypoxia at bottom, stable; Arctic Ocean, DO high, trend uncertain; Hudson Bay, DO high, decreasing DO trend; Labrador Sea, DO high, decreasing DO trend; Gulf of St. Lawrence, hypoxia at bottom, decreasing DO trend; Gulf of St. Lawrence (shallow estuaries), anoxic events at bottom, decreasing DO trend; Emerald Basin, DO low at bottom, decreasing DO trend; Bedford Basin, seasonal hypoxia at bottom, stable. Most of the trends are based on short time series, which could be strongly influenced by natural (e.g., decadal) variability. However, long-term time series do exist for the Northeast Pacific (Station P) and the Gulf of St. Lawrence, and these show statistically significant declining trends.
Figure-7.22

Dissolved oxygen (DO) status and trend in various regions. Most of the trends are based on short time series, which could be strongly influenced by natural (e.g., decadal) variability. However, long-term time series do exist for the Northeast Pacific (Station P) and in the Gulf of St. Lawrence, and these show statistically significant declining trends in DO. The 200 m and 1000 m depth contours are indicated by the light and dark blue lines.

Source

Data from DFO monitoring programs (Galbraith et al., 2017; Yashayaev et al., 2014; Chandler et al., 2017).

Observations off both Pacific and Atlantic coasts of Canada indicate a general decline in the concentration of dissolved oxygen in subsurface (150–400 m) waters below the more continually ventilated surface layer (see Figure 7.23). In the Lower St. Lawrence Estuary, the oxygen decrease has been attributed mainly to an increased inflow of oxygen-poor waters from the North Atlantic’s subtropical gyre (see Box 7.2) entering the mouth of the Laurentian Channel at depth (Gilbert et al., 200549). However, excess nutrient loading from human activity likely plays a role as well (Hudon et al., 201772). The time series from the Labrador Sea indicates a rate of oxygen decline similar to that of the St. Lawrence Estuary, but the record extends back only to 1990 (Yashayaev et al., 2014161). While some estuaries in Prince Edward Island, New Brunswick, and Nova Scotia occasionally become hypoxic (Price et al. 2017121; Burt et al. 20139), the role of ocean-climate change remains unclear.

Figure-7.23

Annual mean dissolved oxygen for Northwest Atlantic and Northeast Pacific Ocean

Four time series of dissolved oxygen concentration in the Atlantic and Pacific oceans surrounding Canada. Dissolved oxygen concentration in the deep waters of the Gulf of St. Lawrence Estuary (1932–2016, significant decreasing trend, 1% level) and depth-averaged dissolved oxygen in the subsurface Labrador Sea (1990–2011, significant decreasing trend, 1% level). Station P subsurface dissolved oxygen concentration at 150 m depth (1956–2017, significant decreasing trend, 1% level) and at 400 m depth (1957–2017, significant decreasing trend, 1% level).
Figure-7.23

Dissolved oxygen concentration at 300 m depth in the Lower St. Lawrence Estuary (1932–2016, declining trend of 0.89 µmol/kg per decade, significant at 1% level); depth-averaged dissolved oxygen concentration in the Labrador Sea (150–400 m, 1990–2011, declining trend of 0.75 µmol/kg per decade, significant at 1% level); Station P dissolved oxygen concentration at 150 m depth (1956–2017, declining trend 0.61 µmol/kg per decade, significant at 1% level [there is only a 1% possibility that such changes are due to chance]) and at 400 m depth (1957–2017, declining trend 0.19 µmol/kg per decade, significant at 1% level).

Source

Data from DFO monitoring programs (Galbraith et al., 2017; Yashayaev et al., 2014; Chandler et al., 2017).

Hypoxia and anoxia have occurred naturally for thousands of years in some inland fjords on the British Columbia coast (Zaikova et al. 2010168). Measurements at Station P dating back to 1956 indicate that ocean oxygen concentrations in the offshore Northeast Pacific have been declining for several decades (Whitney et al. 2007157; Crawford and Peña, 201622; see Figure 7.23). A combination of physical and biological drivers are likely responsible for the observed changes in oxygen concentration at Station P; however, the oxygen variability in the lower ventilated thermocline is a useful tracer of physical climate change (Deutsch et al., 200629). In contrast to the long-term dissolved oxygen decline at Station P, the subsurface waters adjacent to the continental slope of British Columbia demonstrate no clear trend from the 1950s to present (Crawford and Peña, 201622). This highlights that natural decadal variability in the Northeast Pacific Ocean needs to be considered in assessing long-term changes in dissolved oxygen in this region.

Long-term observations in the Arctic are limited, and dissolved oxygen trends are thus uncertain. The Arctic Ocean has shown little evidence of hypoxia and, in fact, primary production within the so-called subsurface temperature maximum (the layer where temperature is highest) raises oxygen levels in the underlying pycnocline (an ocean layer where water density increases rapidly with depth) to levels of supersaturation (Carmack et al., 201011).

Global models project that the total amount of dissolved oxygen loss (averaged over 200-600 m) will be a few percent by the end of the 21st century (Bopp et al., 20136). However, differences in the spatial patterns of dissolved oxygen among models limit confidence in regional projections. Subsurface oxygen concentrations off Canada’s Atlantic and Pacific coasts are expected to continue to decline with increasing CO2 and heat in the atmosphere and with increasing upper-ocean stratification in most areas (Collins et al., 201320).

7.6.3

Ocean nutrients

Nutrients, the fundamental building blocks of life, are necessary to fuel the algal biomass (e.g., phytoplankton) that sustains marine food webs and the ocean’s production of harvestable resources. Algae growth relies on inputs of inorganic nitrogen, phosphorus, silicon, and other nutrients into the sunlit layer near the surface where photosynthesis takes place. These nutrient inputs reach this layer through vertical mixing and transport such as upwelling. Nitrogen is the primary growth-limiting nutrient in the oceans surrounding Canada and is affected by microbial processes that can result in a gain (nitrogen fixation) or loss (e.g., denitrification, nitrous oxide emission). These microbial processes are sensitive to the availability of dissolved oxygen (Gruber, 201152; see Section 7.6.2) and the level of ocean acidification (Das and Mangwani, 201526; see Section 7.6.1).

Climate changes, such as surface warming and decreasing surface salinity, affect nutrients by increasing vertical stratification in the oceans surrounding Canada (see Box 7.4). This increased stratification reduces the nutrient supply transported from deep waters to the surface layer. Such a reduction is important because it can result in chronically low nutrient concentrations in the sunlit layer during the biologically productive spring-to-fall stratification season. While long-term changes in nutrient concentrations can be an indicator of climate change and variability, there are additional factors in the coastal ocean resulting from human activities (e.g., agricultural runoff) that affect local trends.

Nutrient variations in the North Pacific Ocean reflect influences of the Pacific Decadal Oscillation and North Pacific Gyre Oscillation (Di Lorenzo et al., 200931; see Chapter 2, Box 2.5). When the transient effects of these modes of climate variability are removed from the time series of upper-ocean nutrients available in the North Pacific (at less than 20 m depth), decreasing trends over the period 1961–2012 are evident for phosphate and silicate, while concentrations of nitrate remained stable (Yasunaka et al., 2016164). This pattern is consistent with reduced vertical mixing as a result of increasing stratification and, for nitrate, a compensating nitrogen input via atmospheric deposition to the ocean (Duce et al., 200833; Kim et al., 201484). It is important to note that the linear trends in nutrient concentrations are only robust when averaged over the entire North Pacific Ocean, and regional trends are not statistically significant.

In the Northwest Atlantic Ocean adjacent to Canada, no consistent pattern of long-term trends in nutrient concentrations has been observed that could be attributed to climate change (Pepin et al., 2013114). While the eastern Labrador Sea and central Scotian Shelf show significant long-term declines in nitrate, silicate, and phosphate since the 1960s (Yeats et al., 2010165; Pepin et al., 2013114; Hátún et al., 201763), trends in the western Labrador Sea have shown increased silicate concentrations coupled with notable declines in nitrate and, to a lesser extent, phosphate. The opposite pattern has been observed in most parts of the Gulf of Maine and Bay of Fundy (Pepin et al., 2013114). Most parts of the Gulf of St. Lawrence have had notable increases in nutrient concentrations since the early 1970s, but trends in this area are affected by inputs from human activities (see Section 7.6.2). Other areas of the ocean around Atlantic Canada generally have had weak trends that were variable among nutrients.

In the Arctic, there are no long-term records of nutrient concentrations. However, the surface ocean circulation patterns around Canada (see Section 7.1) result in a nutrient connectivity of the Pacific, Arctic, and Atlantic Oceans (Woodgate et al., 2012158; Tremblay et al., 2015143, 2018145), and this may help future research to understand changes in nutrient inventory in the Arctic. There is some evidence that declining sea ice on the Canadian Beaufort Shelf (see Chapter 5, Section 5.3) has led to episodic increases in upward nutrient supply and biological production (Tremblay et al., 2011144). A decline in the nutrient concentration in the central Beaufort Sea has been observed (Li et al., 200989) and modelled (Vancoppenolle et al., 2013147), but evidence of long-term freshening or increased stratification is limited (Peralta-Ferriz and Woodgate, 2015113).


Section summary

In summary, the available long-term time series of key chemical properties in the oceans surrounding Canada indicate trends that are consistent with global analyses. The increases observed in ocean acidification have been directly linked to human emissions of CO2 and their subsequent transfer from the atmosphere to the upper ocean. Under all future emission scenarios, global ocean acidity is expected to continue to increase in the upper ocean, with pH stabilizing by 2100 only under a low emission scenario (RCP2.6). A high emission scenario (RCP8.5) would result in the Arctic surface waters becoming undersaturated by mid-century. Overall, high confidence has been assigned to the key message concerning ocean acidification because of the strong mechanistic understanding of the physical and chemical processes controlling these changes.

Deoxygenation of the subsurface oceans surrounding Canada is evident from high-quality time series over the last five decades in the Northeast Pacific (Station P) and Gulf of St. Lawrence. These trends are consistent with the expectations that surface warming, and in some cases freshening, will increase ocean stratification and thereby reduce vertical mixing and ventilation of the ocean interior. This conclusion has high confidence because of the consistency and quality of the oxygen time series in Canadian waters. In some high-population coastal areas, oxygen depletion is also affected by nutrients from runoff (e.g., agricultural activities). Deoxygenation of the global ocean is expected to continue; however, regional differences in model projections limit us to medium confidence in the expectation that these trends will continue in the subsurface oceans surrounding Canada.

The supply of nutrients to the upper ocean, where photosynthesis takes place, may also be affected by increased stratification as a result of climate change. Nutrient supply to the ocean-surface layer has generally decreased in the North Pacific Ocean, consistent with increasing upper-ocean stratification (medium confidence). No consistent pattern of nutrient change has been observed for the Northwest Atlantic Ocean off Canada. There are no long-term nutrient data available for the Canadian Arctic. The confidence statement in this finding reflects limited data availability, lack of statistical significance of regional trends, and, in some cases, differing trends in a region.
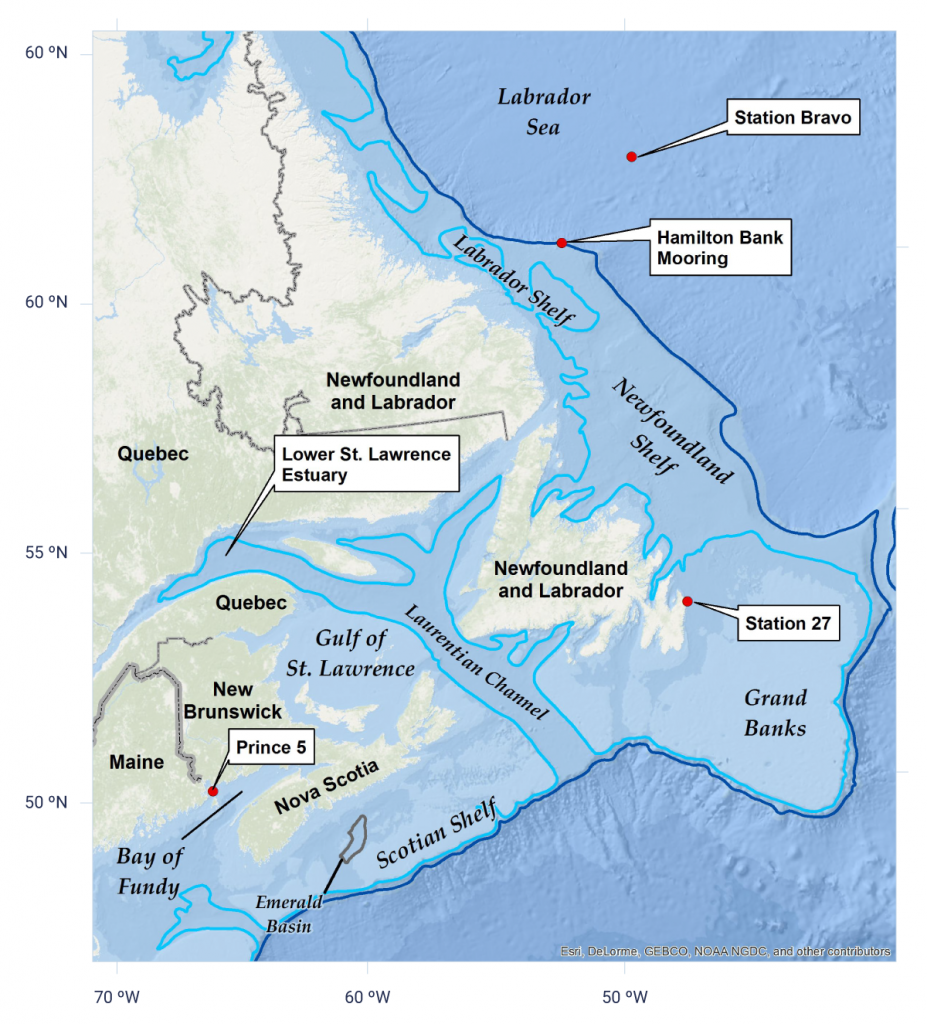
 

Acknowledgments

  • Jim Christian (Fisheries and Oceans Canada)
  • Eugene Colbourne (Fisheries and Oceans Canada)
  • Peter Galbraith, Fisheries and Oceans Canada
  • Phil Greyson (Fisheries and Oceans Canada)
  • Guoqi Han (Fisheries and Oceans Canada)
  • Dave Hebert (Fisheries and Oceans Canada)
  • Roger Pettipas (Fisheries and Oceans Canada)
  • Marie Robert (Fisheries and Oceans Canada)
  • Tetjana Ross (Fisheries and Oceans Canada)
  • Nadja Steiner (Fisheries and Oceans Canada)
  • Igor Yashayaev (Fisheries and Oceans Canada)
  • Li Zhai (Fisheries and Oceans Canada)

Footnotes

  1. This report uses the same calibrated uncertainty language as in the IPCC’s Fifth Assessment Report. The following five terms are used to express assessed levels of confidence in findings based on the availability, quality and level of agreement of the evidence: very low, low, medium, high, very high. The following terms are used to express assessed likelihoods of results: virtually certain (99%–100% probability), extremely likely (95%–100% probability), very likely (90%–100% probability), likely (66%–100% probability), about as likely as not (33%–66% probability), unlikely (0%–33% probability), very unlikely (0%–10% probability), extremely unlikely (0%–5% probability), exceptionally unlikely (0%–1% probability). These terms are typeset in italics in the text. See chapter 1 for additional explanation.
  2. Salinity is a dimensionless (i.e., without units) quantity which corresponds to parts per thousand (of salt in seawater), or grams of salt per kilogram of seawater.
  3. The value of 65 cm is derived from the average of four papers available to the IPCC AR5 (Church et al., 2013) indicating the additional amount of global sea-level rise that could be delivered by the Antarctic Ice Sheet by 2100 due to marine ice sheet instability (see James et al. [2014] for more information on the derivation of the scenario).
  4. Regional sea level data from IPCC AR5 distributed in netCDF format by the Integrated Climate Data Center (ICDC), University of Hamburg, Hamburg, Germany, is available from <http://icdc.cen.uni-hamburg.de/1/daten/ocean/ar5-slr.html>. The modelled vertical crustal motion was removed from the data files and replaced with measured vertical land motion at GPS sites to generate the sea-level projections described here. See James et al. (2014) for more information on how the relative sea-level projections, including projections for the enhanced scenario, were generated.
  5. Because the pH scale is logarithmic, a change of one pH unit corresponds to a 10-fold change in hydrogen ion concentration.

References

  1. Allard, M., Michaud, Y., Ruz, M.H. and Héquette, A. (1998): Ice foot, freeze-thaw of sediments, and platform erosion in a subarctic microtidal environment, Manitounuk Strait, northern Quebec, Canada; Canadian Journal of Earth Sciences, v. 35, p. 965–979.
  2. Atkinson, D.E., Forbes, D.L. and James, T.S. (2016): Dynamic coasts in a changing climate; in Canada’s Marine Coasts in a Changing Climate, (ed.) D.S. Lemmen, F.J. Warren, T.S. James and C.S.L. Mercer Clarke; Government of Canada, Ottawa, Ontario, p. 27–68.
  3. Azetsu-Scott, K., Clarke, A., Falkner, K., Hamilton, J., Jones, E.P., Lee, C., Petrie, B., Prinsenberg, S., Starr M. and Yeats, P. (2010): Calcium carbonate saturation states in the waters of the Canadian Arctic Archipelago and the Labrador Sea; Journal of Geophysical Research, v. 115, C11021. doi:10.1029/2009JC005917
  4. Azetsu-Scott, K., Starr, M., Mei, Z.-P. and Granskog, M. (2014): Low calcium carbonate saturation state in an Arctic inland sea having large and varying fluvial inputs: The Hudson Bay system; Journal of Geophysical Research: Oceans, v. 119, p. 6210–6220. doi:10.1002/2014JC009948
  5. Bernier, N.B. and Thompson, K.R. (2006): Predicting the frequency of storm surges and extreme sea levels in the northwest Atlantic; Journal of Geophysical Research: Oceans, v. 111, C10009. doi:10.1029/2005JC003168
  6. Bopp, L., Resplandy, L., Orr, J.C., Doney, S.C., Dunne, J.P., Gehlen, M., Halloran, P., Heinze, C., Ilyina, T., Séférian, R., Tjiputra, J. and Vichi, M. (2013): Multiple stressors of ocean ecosystems in the 21st century: projections with CMIP5 models; Biogeosciences, v. 10, p. 6225–6245, doi:10.5194/bg-10-6225-2013
  7. Breitburg, D., Levin, L.A., Oschlies, A., Grégoire, M., Chavez, F.P., Conley, D.J., Garçon, V., Gilbert, D., Gutiérrez, D., Isensee, K., Jacinto, G.S., Limburg, K.E., Montes, I., Naqvi, S.W.A., Pitcher, G.C., Rabalais, N.N., Roman, M.R., Rose, K.A., Seibel, B.A., Telszewski, M., Yasuhara, M., and Zhang, J. (2018): Declining oxygen in the global ocean and coastal waters; Science, v. 359. doi: 10.1126/science.aam7240
  8. Bromirski, P.D., and Cayan, D.R. (2015): Wave power variability and trends across the North Atlantic influenced by decadal climate patterns; Journal of Geophysical Research: Oceans, v. 120, p. 3419–3443. doi:10.1002/2014JC010440
  9. Burt, W.J., Thomas, H., Fennel, K., and Horne, E. (2013): Sediment-water column fluxes of carbon, oxygen and nutrients in Bedford Basin, Nova Scotia, inferred from 224Ra measurements; Biogeosciences, v. 10, p. 53–66. doi:10.5194/bg-10-53-2013
  10. Cai, W., Borlace, S., Lengaigne, M., Rensch, P., Collins, M., Vecchi, G., Timmermann, A., Santoso, A., McPhanden, M.J., Wu, L., England, M.H., Wang, G., Guilyardi, E. and Jin, F. (2014): Increasing frequency of extreme El Niño events due to greenhouse warming; Nature Climate Change, v. 4, p. 111–116. doi:10.1038/NCLIMATE2100
  11. Carmack, E.C., McLaughlin, F.A., Vagle, S., Melling, H., and Williams, W.J. (2010): Structures and property distributions in the three oceans surrounding Canada in 2007: a basis for a long‐term ocean climate monitoring strategy; Atmosphere-Ocean, v. 48, p. 211–224.
  12. Casas-Prat, M., Wang, X.L. and Swart, N. (2018): CMIP5-based global wave climate projections including the entire Arctic Ocean; Ocean Modelling, v. 123, p. 66–85. doi:10.1016/j.ocemod.2017.12.003
  13. Chandler, P.C., King, S.A., and Boldt, J. (eds.) (2017): State of the physical, biological and selected fishery resources of Pacific Canadian marine ecosystems in 2016; Canadian Technical Report of Fisheries and Aquatic Science 3225, 243 p.
  14. Cheng, L., Trenberth, K.E., Fasullo, J., Boyer, T., Abraham, J. and Zhu, J. (2017): Improved estimates of ocean heat content from 1960 to 2015; Science Advances, v. 3. doi:10.1126/sciadv.1601545
  15. Chierici, M. and Fransson, A. (2009): Calcium carbonate saturation in the surface water of the Arctic Ocean: Undersaturation in freshwater influenced shelves; Biogeosciences, v. 6, p. 2421–2432. <http://www.biogeosciences.net/6/2421/2009>.
  16. Christian, J.R. and Foreman, M.G.G. (eds.) (2013): Climate trends and projections for the Pacific Large Aquatic Basin; Canadian Technical Report of Fisheries and Aquatic Science 3032, 113 p.
  17. Christian, J.R. and Holmes, J. (2016): Changes in albacore tuna habitat in the northeast Pacific Ocean under anthropogenic warming; Fisheries Oceanography, v. 25, p. 544–554. doi:10.1111/fog.12171
  18. Church, J.A., Clark, P.U., Cazenave, A., Gregory, J.M., Jevrejeva, S., Levermann, A., Merrifield, M.A., Milne, G.A., Nerem, R.S., Nunn, P.D., Payne, A.J., Pfeffer, W.T., Stammer, D. and Unnikrishnan, A.S. (2013): Sea level change; in Climate Change 2013: The Physical Science Basis; Contribution of Working Group I to the Fifth Assessment Report of the Intergovernmental Panel on Climate Change (IPCC), (ed.) T.F. Stocker, D. Quin, G.-K. Plattner, M. Tignor, S.K. Allen, J. Boschung, A. Nauels, Y. Xia, V. Bex and P.M. Migdley; Cambridge University Press, Cambridge, United Kingdom and New York, NY, USA, p. 1137–1216, <https://www.ipcc.ch/site/assets/uploads/2018/02/WG1AR5_Chapter13_FINAL.pdf>.
  19. Colbourne, E., Holden, J., Snook, S., Han, G., Lewis, S., Senciall, D., Bailey, W., Higdon, J. and Chen, N. (2017): Physical oceanographic conditions on the Newfoundland and Labrador Shelf during 2016; Fisheries and Oceans Canada, Canadian Science Advisory Secretariat, Research Document 079, 50 p.
  20. Collins, M., Knutti, R., Arblaster, J., Dufresne, J.-L., Fichefet, T., Friedlingstein, P., Wehner, M. (2013): Long-term climate change: Projections, commitments and irreversibility; in Climate change 2013: The physical science basis; Contribution of Working Group I to the Fifth Assessment Report of the Intergovernmental Panel on Climate Change, (ed.) T. F. Stocker, D. Qin, G.-K. Plattner, M. Tignor, S. K. Allen, J. Boschung, A. Nauels, Y. Xia, V. Bex and P. M. Midgley; Cambridge University Press, Cambridge, United Kingdom and New York, NY, USA, p. 1029–1136.
  21. Cornford, S.L., Martin, D.F., Payne, A.J., Ng, E.G., Le Brocq, A.M., Gladstone, R.M., Edwards, T.L., Shannon, S.R., Agosta, C., van den Broeke, M.R., Hellmer, H.H., Krinner, G., Ligtenberg, S.R.M., Timmermann, R. and Vaughan, D.G. (2015): Century-scale simulations of the response of the West Antarctic Ice Sheet to a warming climate; The Cryosphere, v. 9, p. 1579–1600. doi:10.5194/tcd-9-1887-2015
  22. Crawford, W. R., and Peña, M. A. (2016): Decadal trends in oxygen concentration in subsurface waters of the Northeast Pacific Ocean; Atmosphere-Ocean, v. 54, p. 171–192.
  23. Crawford, W.R., Galbraith, J. and Bolingbroke, N. (2007): Line P ocean temperature and salinity, 1956–2005; Progress in Oceanography, v. 75, p. 161–178.
  24. Craymer, M. and Robin, C. (2016): A national crustal velocity model for Canada; US National Geodetic Survey Brown Bag Lecture, Silver Spring, Maryland, 18 p. <https://mcraymer.github.io/geodesy/pubs/crustalmotion_ngs2016.pdf>.
  25. Dangendorf, S., Marcos, M., Wöppelmann, G., Conrad, C.P., Frederikse, T. and Rive, R. (2017): Reassessment of 20th century global mean sea level rise; Proceedings of the National Academy of Science, v. 114, p. 5946–5951. doi:10.1073/pnas.1616007114
  26. Das, S. and Mangwani, N. (2015): Ocean acidification and marine microorganisms: responses and consequences; Oceanologia, v. 57, p. 349–361. doi:10.1016/j.oceano.2015.07.003.
  27. DeConto, R.M. and Pollard, D. (2016): Contribution of Antarctica to past and future sea-level rise; Nature, v. 531, p. 591–597. doi:10.1038/nature17145
  28. Delworth, T. and Zeng, F. (2016): The impact of the North Atlantic Oscillation on climate through its influence on the Atlantic Meridional Overturning Circulation; Journal of Climate, v. 29, p. 941–962. doi:10.1175/JCLI-D-15-0396.1
  29. Deutsch, C., Emerson, S. and Thompson, L. (2006): Physical-biological interactions in North Pacific oxygen variability; Journal of Geophysical Research, v. 111. doi:10.1029/2005JC003179
  30. Dickson, A.G., Sabine, C.L. and Christian, J.R. (eds.) (2007): Guide to best practices for ocean CO2 measurement; PICES Special Publication 3, IOCCP Report 8, North Pacific Marine Science Organization, Sidney, British Columbia, 191 p.
  31. Di Lorenzo, E., Fiechter, J., Schneider, N., Bracco, A., Miller, J., Franks, P.J.S., Bograd S.J., Moore, A.M., Thomas, A.C., Crawford, W., A. Peña, A. and Hermann, A.J. (2009): Nutrient and salinity decadal variations in the central and eastern North Pacific; Geophysical Research Letter, v. 36. doi:10.1029/2009GL038261
  32. Drijfhout, S., van Oldenborgh, G. J., and Cimatoribus, A. (2012): Is a decline of AMOC causing the warming hole above the North Atlantic in observed and modeled warming patterns?; Journal of Climate, v. 25, p. 8373–8379. doi:10.1175/JCLI-D-12-00490.1
  33. Duce, R.A., LaRoche, J., Altieri, K., Arrigo, K.R., Baker, A.R., Capone, D.G., Cornell, S., Dentener, F., Galloway, J., Ganeshram, R.S., Geider, R.J., Jickells, T., Kuypers, M.M., Langlois, R., Liss, P.S., Liu, S.M., Middelburg, J.J., Moore, C.M., Nickovic, S., Oschlies, A., Pedersen, T., Prospero, J., Schlitzer, R., Seitzinger, S., Sorensen, L.L., Uematsu, M., Ulloa, O., Voss, M., Ward, B. and Zamora, L. (2008): Impacts of atmospheric anthropogenic nitrogen on the open ocean; Science, v. 320, p. 893–897.
  34. Durack, P.J. and Wijffels, S.E. (2010): Fifty-year trends in global ocean salinities and their relationship to broad-scale warming; Journal of Climate, v. 23, p. 4342–4362.
  35. Durack, P. J., Wijffels, S. E., and Matear, R. J. (2012): Ocean salinities reveal strong global water cycle intensification during 1950 to 2000. Science, v. 336, 455–458. doi:10.1126/science.1212222
  36. Erikson, L.H., Hegermiller, C.A., Barnard, P.L., Ruggiero, P. and van Ormondt, M. (2015): Projected wave conditions in the Eastern North Pacific under the influence of two CMIP5 climate scenarios; Ocean Modelling, v. 96, p. 171–185. doi: 10.1016/j.ocemod.2015.07.004
  37. Farrell, W.E. and Clark, J.A. (1976): On postglacial sea level; Geophysical Journal International, v. 46, p. 647–667.
  38. Feely, R.A., Doney, S. C., and Cooley, S. R. (2009): Ocean acidification: Present conditions and future changes in a high-CO2 world. Oceanography, v. 22, p. 36–47. doi: 10.5670/oceanog.2009.95
  39. Feely, R.A., Sabine, C.L., Hernandez-Ayon, J.M., Ianson, D. and Hales, B. (2008): Evidence for upwelling of corrosive “acidified” water onto the continental shelf; Science, v. 320, p. 1490–1492.
  40. Feely, R.A., Sabine, C.L., Lee, K., Berelson, W., Kleypas J., Fabry, V.K. and Millero, F.J. (2004): Impact of anthropogenic CO2 on the CaCO3 system in the oceans; Science, v. 305, p. 362–366. doi: 10.1126/science.1097329
  41. Forbes, D.L. and Taylor, R.B. (1994): Ice in the shore zone and the geomorphology of cold coasts. Progress in Physical Geography, v. 18, p. 59–89. doi: 10.1177/030913339401800104
  42. Francis, O.P., Planteleev, G.G. and Atkinson, V.E. (2011): Ocean wave conditions in the Chukchi Sea from satellite and in situ observations; Geophysical Research Letters, v. 38. doi:10.1029/2011GL049839
  43. Freeland, H.J. (2013): Evidence of change in the winter mixed layer in the Northeast Pacific Ocean: a problem revisited; Atmosphere-Ocean, v. 51, p. 126–133. doi: 10.1080/07055900.2012.754330
  44. Galbraith, P.S. and Larouche, P. (2013): Trends and variability in eastern Canada sea-surface temperatures; in Aspects of climate change in the Northwest Atlantic off Canada, (ed.) J.W. Loder, G. Han, P.S. Galbraith, J. Chassé and A. van der Baaren; Canadian Technical Report of Fisheries and Aquatic Sciences 3045, p. 1–18.
  45. Galbraith, P.S., Chassé, J., Caverhill, C., Nicot, P., Gilbert, D., Pettigrew, B., Lefaivre, D., Brickman, D., Devine, L. and Lafleur, C. (2017): Physical oceanographic conditions in the Gulf of St. Lawrence in 2016; DFO Canadian Science Advisory Secretariat, Research Document 044, 91 p.
  46. Galbraith, P.S., Larouche, P., Chasse, J. and Petrie, B. (2012): Sea-surface temperature in relation to air temperature in the Gulf of St. Lawrence: interdecadal variability and long term trends; Deep Sea Research Part II: Topical Studies in Oceanography, v. 77–80, p. 10–20, doi:10.1016/j.dsr2.2012.04.001
  47. Gemmrich, J., Thomas, B., and Bouchard, R. (2011): Observational changes and trends in northeast Pacific wave records. Geophysical Research Letters, v. 38, L22601. doi: 10.1029/2011GL049518
  48. Gilbert, D., Rabalais, N.N., Díaz, R.J. and Zhang, J. (2010): Evidence for greater oxygen decline rates in the coastal ocean than in the open ocean; Biogeosciences, v. 7, p. 2283–2296.
  49. Gilbert, D., Sundby, B., Gobeil, C., Mucci, A. and Tremblay, G.-H. (2005): A seventy-two year record of diminishing deep-water oxygen levels in the St. Lawrence estuary: The northwest Atlantic connection; Limnology and Oceanography, v. 50, p. 1654–1666.
  50. Gledhill, D.K., White, M.M., Salisbury, J., Thomas, H., Mlsna, I., Liebman, M., Mook, B., Grear, J., Candelmo, A.C., Chambers, R.C., Gobler, C.J., Hunt, C.W., King, A.L., Price, N.N., Signorini, S.R., Stancioff, E., Stymiest, C., Wahle, R.A., Waller, J.D., Rebuck, N.D., Wang, Z.A., Capson, T.L., Morrison, J.R., Cooley, S.R. and Doney, S.C. (2015): Ocean and coastal acidification off New England and Nova Scotia; Oceanography, v. 28, p. 182–197. doi:10.5670/oceanog.2015.41
  51. Golledge, N., Kowalewski, D., Naish, T., Levy, R., Fogwill, C. and Gasson, E. (2015): The multi-millennial Antarctic commitment to future sea-level rise; Nature, v. 526, p. 421–425. doi:10.1038/nature15706
  52. Gruber, N. (2011): Warming up, turning sour, losing breath: ocean biogeochemistry under global change; Philosophical Transactions of the Royal Society A, v. 369, p. 1980–1996. doi: 10.1098/rsta.2011.0003
  53. Gulev, S.K. and Grigorieva, V. (2006): Variability of the Winter Wind Waves and Swell in the North Atlantic and North Pacific as Revealed by the Voluntary Observing Ship Data; Journal of Climate, v. 19, p. 5667–5685. doi: 10.1175/JCLI3936.1
  54. Guo, L.L., Perrie, W., Long, Z.X., Toulany, B. and Sheng, J.Y. (2015): The impacts of climate change on the north Atlantic wave climate; Atmosphere-Ocean, v. 53, p. 491–509. doi:10.1080/07055900.2015.1103697
  55. Haigh, R., Ianson, D., Holt, C.A., Neate, H E. and Edwards, A.M. (2015): Effects of ocean acidification on temperate coastal marine ecosystems and fisheries in the northeast Pacific; PLoS One, v. 10, e0117533, doi:10.1371/journal.pone.0117533
  56. Haine, T.W.N., Curry, B., Rüdiger Gerdes, R., Edmond Hansen, E., Karcher, M., Lee, C., Bert Rudels, B., Spreen, G., de Steur, L., Stewart, K.D., and Woodgate, R. (2015): Arctic freshwater export: Status, mechanisms, and prospects. Global and Planetary Change, v. 125, p. 13–35. doi:10.1016/j.gloplacha.2014.11.013
  57. Hamilton, J.M. and Wu, Y. (2013): Synopsis and trends in the physical environment of Baffin Bay and Davis Strait; Canadian Technical Report of Hydrography and Ocean Science 282, 39 p.
  58. Han, G., Colbourne, E., Pierre, P. and Xie, Y. (2015a): Statistical projections of ocean climate indices off Newfoundland and Labrador; Atmosphere-Ocean, v. 53, p. 556–570. doi:10.1080/07055900.2015.1047732
  59. Han, G., Ma, Z., Chen, D., deYoung, B. and Chen N. (2012): Observing storm surges from space: Hurricane Igor off Newfoundland; Scientific Reports, v. 2. doi:10.1038/srep01010
  60. Han, G., Ma, Z., Chen, N., Thomson, R. and Slangen, A. (2015b): Changes in mean relative sea level around Canada in the twentieth and twenty-first centuries; Atmosphere-Ocean, v. 53, p. 452–463. doi:10.1080/07055900.2015.1057100
  61. Han, G., Ma, Z., Chen, N., Yang, J. and Chen, N. (2015c): Coastal sea level projections with improved accounting for vertical land motion; Scientific Reports, v. 5. doi:10.1038/srep16085
  62. Hartmann, D.L., Klein Tank, A.M.G., Rusticucci, M., Alexander, L.V., Brönnimann, S., Charabi, Y., Dentener, F.J., Dlugokencky, E.J., Easterling, D.R., Kaplan, A., Soden, B.J., Thorne, P.W., Wild M. and Zhai, P.M. (2013): Observations: Atmosphere and surface; in Climate Change 2013: The Physical Science Basis; Contribution of Working Group I to the Fifth Assessment Report of the Intergovernmental Panel on Climate Change, (ed.) T.F. Stocker, D. Qin, G.-K. Plattner, M. Tignor, S.K. Allen, J. Boschung, A. Nauels, Y. Xia, V. Bex and P.M. Midgley; Cambridge University Press, Cambridge, United Kingdom and New York, NY, USA, p. 159–254.
  63. Hátún, H., Azetsu-Scott, K., Somavilla, R., Rey, F., Johnson, C., Mathis, M., Mikolajewicz, U., Coupel, P., Tremblay, J.-É., Hartman, S., Pacariz, S. V., Salter, I. and Ólafsson, J. (2017): The subpolar gyre regulates silicate concentrations in the North Atlantic; Nature Scientific Reports, v. 7. doi: 10.1038/s41598-017-14837-4
  64. Hay, C.C., Morrow, E., Kopp, R.E. and Mitrovica, J.X. (2015): Probabilistic reanalysis of twentieth-century sea-level rise; Nature, v. 517, p. 481–484. doi:10.1038/nature14093
  65. Hebert, D. (2013): Trends of temperature, salinity and stratification in the upper ocean for different regions of the Atlantic Canadian shelf; in Aspects of Climate Change in the Northwest Atlantic off Canada, (ed.) J.W. Loder, G. Han, P.S. Galbraith, J. Chassé and A. van der Baaren; Canadian Technical Report of Fisheries and Aquatic Science 3045, p. 33–42.
  66. Hebert, D., Pettipas, R., Brickman, D. and Dever, M. (2016): Meteorological, sea ice and physical oceanographic conditions on the Scotian Shelf and in the Gulf of Maine during 2015; DFO Canadian Science Advisory Secretariat, Research Document 083, 49 p.
  67. Hegerl, G.C., Zwiers, F.W., Braconnot, P., Gillet, N.P., Luo, Y., Marengo, J.A. and Stott, P.A. (2007): Understanding and attributing climate change; in Climate Change 2007: The Physical Science Basis; Contribution of Working Group I to the Fourth Assessment Report of the Intergovernmental Panel on Climate Change, (ed.) S. Solomon, D. Qin, M. Manning, Z. Chen, M. Marquis, K.B. Averyt, H.L. Miller; Cambridge University Press, Cambridge, United Kingdom, New York, NY, USA, p. 663–745.
  68. Helm, K.P., Bindoff, N.L. and Church, J.A. (2010): Changes in the global hydrological‐cycle inferred from ocean salinity, Geophysical Research Letters, v. 37. doi:10.1029/2010GL044222
  69. Hönisch, B., Ridgwell, A., Schmidt, D.N., Thomas, E., Gibbs, S.J., Sluijs, A., Zeebe, R.E., Kump, L., Martindale, R.C., Greene, S.E., Kiessling, W., Ries, J., Zachos, J., Royer, D.L., Barker, S., Marchitto Jr., T.M., Moyer, R., Pelejero, C., Ziveri, P., Foster, G.L. and Williams, B. (2012): The geological record of ocean acidification; Science, v. 335, p. 1058–1063. doi:10.1126/science.1208277
  70. Hu, X. and Myers, P.G. (2014): Changes to the Canadian Arctic Archipelago sea ice and freshwater fluxes in the twenty-first century under the Intergovernmental Panel on Climate Change A1B climate scenario; Atmosphere-Ocean, v. 52, p. 331–350. doi:10.1080/07055900.2014.942592
  71. Huang, B., Kennedy, J., Xue, Y. and Zhang, H.-M. (2017): Sea surface temperatures; in State of the Climate in 2016; Bulletin of the American Meteorological Society, v. 98, p. S93–S98. doi:10.1175/2017BAMSStateoftheClimate.1
  72. Hudon, C., Gagnon, P., Rondeau, M., Hébert, M.-P., Gilbert, D., Hill, B., Patoine, M. and Starr, M. (2017): Hydrological and biological processes modulate carbon, nitrogen and phosphorus flux from the St. Lawrence River to its estuary (Quebec, Canada); Biogeochemistry; v. 135, p. 251–276. doi:10.1007/s10533-017-0371-4
  73. Ianson, D., Allen, S.E., Harris, S., Orians, K.J., Varela, D.E. and Wong, C.S. (2003): The inorganic carbon system in the coastal upwelling region west of Vancouver Island, Canada; Deep Sea Research I, v. 50, p. 1023–1042. doi:10. 1016/S0967-0637(03)00114-6
  74. Ianson, D., Allen, S.E., Moore-Maley, B.L., Johannessen, S.C. and Macdonald, R.W. (2016): Vulnerability of a semi-enclosed estuarine sea to ocean acidification in contrast with hypoxia; Geophysical Research Letter, v. 43, p. 5793–5801. doi:10.1002/2016GL068996
  75. Ianson, D., Feely, R.A., Sabine, C.L. and Juranek, L. (2009): Features of coastal upwelling regions that determine net air-sea CO2 flux; Journal of Oceanography; v. 65, p. 677–687. doi: 10.1007/s10872-009-0059-z
  76. IPCC [Intergovernmental Panel on Climate Change] (2013): Summary for policymakers; in Climate Change 2013: The Physical Science Basis; Contribution of Working Group I to the Fifth Assessment Report of the Intergovernmental Panel on Climate Change, (ed.) T.F. Stocker, D. Qin, G.-K. Plattner, M. Tignor, S.K. Allen, J. Boschung, A. Nauels, Y. Xia, V. Bex and P.M. Midgley; Cambridge University Press, Cambridge, United Kingdom and New York, NY, p. 3–29, <https://www.ipcc.ch/site/assets/uploads/2018/02/WG1AR5_SPM_FINAL.pdf>.
  77. Ito, T., Minobe, S., Long, M.C. and Deutsch, C. (2017): Upper ocean O2 trends: 1958–2015; Geophysical Research Letter, v. 44, p. 4214–4223. doi:10.1002/2017GL073613
  78. James, T.S., Henton, J.A., Leonard, L.J., Darlington, A., Forbes, D.L. and Craymer, M. (2014): Relative sea level rise projections for Canada and the adjacent mainland United States; Geological Survey of Canada, Open File 7737, 67 p., <http://publications.gc.ca/collections/collection_2016/rncan-nrcan/M183-2-7737-eng.pdf>.
  79. James, T.S., Henton, J.A., Leonard, L.J., Darlington, A., Forbes, D.L. and Craymer, M. (2015): Tabulated values of relative sea-level projections in Canada and the adjacent mainland United States; Geological Survey of Canada, Open File 7942, 81 p., doi:10.4095/297048
  80. Jewett, L. and Romanou, A. (2017): Ocean acidification and other ocean changes; in Climate Science Special Report: Fourth National Climate Assessment, Volume I, (ed.) D.J. Wuebbles, D.W. Fahey, K.A. Hibbard, D.J. Dokken, B.C. Stewart, and T.K. Maycock; US Global Change Research Program, Washington, District of Columbia, p. 364–392. doi:10.7930/J0QV3JQB
  81. Jiang, J. and Perrie, W. (2007): The impacts of climate change on autumn North Atlantic midlatitude Cyclones; Journal of Climate, v. 20, p. 1174–1187. doi:10.1175/JCLI4058.1
  82. Jiang, J. and Perrie, W. (2008): Climate change effects on North Atlantic cyclones; Journal of Geophysical Research, v. 113. doi:10.1029/2007JD008749
  83. Joughin, I., Smith, B. and Medley, B. (2014): Marine ice sheet collapse potentially under way for the Thwaites Glacier Basin, West Antarctica; Science, v. 344, p. 735–738. doi:10.1126/science.1249055
  84. Kim, I.N., Lee, K., Gruber, N., Karl, D.M., Bullister, J.L., Yang, S. and Kim, T.W. (2014): Increasing anthropogenic nitrogen in the North Pacific Ocean; Science, v. 346, p. 1102–1106. doi:10.1126/science.1258396
  85. Kossin, J.P., Hall, T., Knutson, T., Kunkel, K.E., Trapp, R.J., Waliser, D.E. and Wehner, M.F. (2017): Extreme storms; in Climate Science Special Report: Fourth National Climate Assessment, Volume I, (ed.) D.J Wuebbles, D.W. Fahey, K.A. Hibbard, D.J. Dokken, B.C. Stewart, and T.K. Maycock; US Global Change Research Program, Washington, District of Columbia, p. 257–276. doi: 10.7930/J07S7KXX
  86. Larouche, P. and Galbraith, P.S. (2016): Canadian coastal seas and Great Lakes Sea surface temperature climatology and recent trends; Canadian Journal of Remote Sensing, v. 42, p. 243–258. doi:10.1080/07038992.2016.1166041
  87. Lemmen, D.S., Warren, F.J., James, T.S. and Mercer Clarke, C.S.L. (eds.) (2016): Canada’s Marine Coasts in a Changing Climate; Government of Canada, Ottawa, Ontario, 274 p. <https://www.nrcan.gc.ca/sites/www.nrcan.gc.ca/files/earthsciences/pdf/assess/2016/Coastal_Assessment_FullReport.pdf>.
  88. Levermann, A., Winkelmann, R., Nowicki, S., Fastook, J.L., Frieler, K., Greve, R., Hellmer, H.H., Martin, M.A., Meinshausen, M., Mengel, M., Payne, A.J., Pollard, D., Sato, T., Timmermann, R., Wang, W.L. and Bindschadle, R.A. (2014): Projecting Antarctic ice discharge using response functions from SeaRISE ice-sheet models; Earth System Dynamics, v. 5, p. 271–293. doi: 10.5194/esd-5-271-2014
  89. Li, W.K.W., McLaughlin, F.A., Lovejoy, C. and Carmack, E.C. (2009): Smallest algae thrive as the Arctic Ocean freshens; Science; v. 326, p. 539. doi:10.1126/science.1179798
  90. Lintern, D.G., MacDonald, R.W., Solomon, S.M., and Jakes, H. (2011): Beaufort Sea storm and resuspension modeling, Journal of Marine Systems, v. 127, p. 14–25. doi:10.1016/j.jmarsys.2011.11.015
  91. Liu, Q., Babanin, A.V., Zieger, S., Young, I.R. and Guan, C. (2016): Wind and wave climate in the Arctic Ocean as observed by altimeters; Journal of Climate, v. 29, p. 7957–7975. doi:10.1175/JCLI-D-16-0219.1
  92. Loder, J.W. and van der Baaren, A. (2013): Climate change projections for the Northwest Atlantic from six CMIP5 Earth system models; Canadian Technical Report of Hydrogeology and Ocean Science 286, 112 p.
  93. Loder, J.W. and Wang, Z. (2015): Trends and variability of sea surface temperature in the Northwest Atlantic from three historical gridded datasets; Atmosphere-Ocean, v. 53, p. 510–528. doi:10.1080/07055900.2015.1071237
  94. Loder, J.W., van der Baaren, A. and Yashayaev, I. (2015): Climate comparisons and change projections for the Northwest Atlantic from six CMIP5 models; Atmosphere-Ocean, v. 53, p. 529–555. doi: 10.1080/07055900.2015.1087836
  95. Long, Z., Perrie, W., Chassé, J., Brickman, D., Guo, L., Drozdowski, A. and Hu, H. (2015): Impacts of Climate Change in the Gulf of St. Lawrence; Atmosphere-Ocean, v. 54, p. 337–351. doi:10.1080/07055900.2015.1029869
  96. Long, Z., Perrie, W., Chassé, J., Brickman, D., Guo, L., Drozdowski, A. and Hu, H. (2016): Impacts of Climate Change in the Gulf of St. Lawrence, Atmosphere-Ocean, v. 54, p. 337–351, doi:10.1080/07055900.2015.1029869
  97. Lozier, M.S., Leadbetter, S., Williams, R.G., Roussenov, V., Reed, M.S.C. and Moore, N J. (2008): The spatial pattern and mechanisms of heat-content change in the North Atlantic; Science, v. 319, p. 800–803. doi: 10.1126/science.1146436
  98. Ma, Z., Han, G. and de Young, B. (2015): Oceanic responses to Hurricane Igor over the Grand Banks: A modelling study; Journal of Geophysical Research: Oceans, v. 120, p. 1276–1295. doi:10.1002/2014JC010322
  99. Manson, G.K. and Solomon, S.M. (2007): Past and future forcing of Beaufort Sea coastal change; Atmosphere-Ocean, v. 45, p. 107–122.
  100. Markovic, M., de Elía, R., Frigon, A. and Matthews, H.D. (2013): A transition from CMIP3 to CMIP5 for climate information providers: the case of surface temperature over eastern North America; Climatic Change, v. 120, p. 197–210. doi:10.1007/s10584-013-0782-8
  101. Mazzotti, S., Lambert, A., van der Kooij, M. and Mainville, A. (2009): Impact of anthropogenic subsidence on relative sea-level rise in the Fraser River delta; Geology, v. 37, p. 771–774. doi: 10.1130/G25640A.1
  102. Mercer Clarke, C.S.L., Manuel, P. and Warren, F.J. (2016): The coastal challenge; in Canada’s Marine Coasts in a Changing Climate, (ed.) D.S. Lemmen, F.J. Warren, T.S. James and C.S.L. Mercer Clarke; Government of Canada, Ottawa, Ontario, p. 69–98, <https://www.nrcan.gc.ca/sites/www.nrcan.gc.ca/files/earthsciences/pdf/assess/2016/Coastal_Assessment_Chapter3_CoastalChallenge.pdf>.
  103. Mitrovica, J.X., Gomez, N., Morrow, E., Hay, C. and Tamisiea, M.E. (2011): On the robustness of predictions of sea level fingerprints; Geophysical Journal International, v. 187, p. 729–742. doi: 10.1111/j.1365-246X.2011.05090.x
  104. Mitrovica, J.X., Tamisiea, M.E., Davis, J.L. and Milne, G.A. (2001): Recent mass balance of polar ice sheets inferred from patterns of global sea-level change; Nature, v. 409, p. 1026–1029.
  105. Moore-Maley, B.L., Allen, S.E. and Ianson, D. (2016): Locally driven interannual variability of near-surface pH and ΩA in the Strait of Georgia; Journal of Geophysical Research: Oceans, v. 121, p. 1600–1625. doi:10.1002/2015JC011118
  106. Moss, R.H., Edmonds, J.A., Hibbard, K.A., Manning, M.R., Rose, S.K., van Vuuren, D.P., Carter, T.R., Emori, S., Kainuma, M., Kram, T., Meehl, G.A., Mitchell, J.F.B., Nakicenovic, N., Riahi, K., Smith, S.J., Stouffer, R.J., Thomson, A.M., Weyant, J.P. and Wilbanks, T.J. (2010): The next generation of scenarios for climate change research and assessment; Nature, v. 463, p. 747–756.
  107. Mucci, A., Starr, M., Gilbert, D. and Sundby, B. (2011): Acidification of lower St. Lawrence Estuary bottom waters, Atmosphere-Ocean; v. 49, p. 206–218. doi: 10.1080/07055900.2011.599265
  108. Mullan, B., Salinger, J., Thompson, C., Ramsay, D. and Wild, M. (2005): Chatham Islands Climate Change, National Institute of Water & Atmospheric Research Ltd.; NIWA Client Report WLG2005-35, Wellington, New Zealand, <http://www.mfe.govt.nz/sites/default/files/chatham-islands-climate-change-jun05.pdf>.
  109. Nicholls, R.J., Hanson, S.E., Lowe, J.A., Warrick, R.A., Lu, X., Long, A.J. and Carter, T.A. (2011): Constructing sea-level scenarios for impact and adaptation assessment of coastal areas: a guidance document; Intergovernmental Panel on Climate Change (IPCC), Task Group on Data and Scenario Support for Impact and Climate Analysis, Geneva, Switzerland, 47 p., <http://www.ipcc-data.org/docs/Sea_Level_Scenario_Guidance_Oct2011.pdf>.
  110. Oschlies, A., Shulz, K. G., Riebesell, U. and Schmittner, A. (2008): Simulated 21st century’s increase in oceanic suboxia by CO2-enhanced biotic carbon export; Global Biogeochemical Cycles, v. 22, GB4008. doi:10.1029/2007GB003147
  111. Ouellet, M., Petrie, B., Chassé, J. and Gilbert, D. (2011): Temporal and spatial scales of temperature, salinity and current velocity on the Newfoundland Grand Banks and in the Gulf of St. Lawrence; Canadian Technical Report of Hydrogeology and Ocean Sciences 272, 78 p.
  112. Parris, A., Bromirski, P. Burkett, V., Cayan, D., Culver, M., Hall, J., Horton, R., Knuuti, K., Moss, R., Obeysekera, J., Sallenger, A. and Weiss, J. (2012): Global sea level rise scenarios for the US National Climate Assessment; NOAA Technical Memo OAR CPO-1, 37 p.
  113. Peralta-Ferriz, C. and Woodgate, R.A. (2015): Seasonal and interannual variability of pan-Arctic surface mixed layer properties from 1979 to 2012 from hydrographic data, and the dominance of stratification for multiyear mixed layer depth shoaling; Progress in Oceanography, v. 134, p. 19–53.
  114. Pepin, P., Maillet, G.L., Lavoie D. and Johnson, C. (2013): Temporal trends in nutrient concentrations in the northwest Atlantic basin; in Aspects of climate change in the Northwest Atlantic off Canada, (ed.) J.W. Loder, G. Han, P.S. Galbraith, J. Chassé and A. van der Baaren; Canadian Technical Report on Fisheries and Aquatic Science 3045, p. 127–150.
  115. Perrie, W., Long, Z., Chassé, J., Blokhina, M., Guo, L., and Hu, H. (2015): Projected Changes in Surface Air Temperature and Surface Wind in the Gulf of St. Lawrence, Atmosphere-Ocean, v. 53, p. 571–581. doi: 10.1080/07055900.2015.1086295
  116. Perrie, W., Yao, Y. and Zhang, W. (2010): On the impacts of climate change and the upper ocean on midlatitude northwest Atlantic landfalling cyclones; Journal of Geophysical Research, v. 115, 14 p. doi:10.1029/2009JD013535
  117. Peters, G.P., Andrew, R.M., Boden, T., Canadell, J.G., Ciais, P., Le Quéré, C., Marland, G., Raupach, M.R. and Wilson, C. (2013): The challenge to keep global warming below 2 °C; Nature Climate Change, v. 3, p. 4–6. doi:10.1038/nclimate1783
  118. Peters, G.P., Le Quéré, C., Andrew, R.M., Canadell, J.G., Friedlingstein, P., Ilyina, T., Jackson, R. B., Joos, F., Korsbakken, J.I., McKinley, G.A., Sitch, S. and Tans, P. (2017): Towards real-time verification of CO2 emissions; Nature Climate Change, v. 7, p. 848–850. doi:10.1038/s41558-017-0013-9
  119. Petrie, B. and Dean-Moore, J. (1996): Temporal and spatial scales of temperature and salinity on the Scotian Shelf. Canadian Technical Report of Hydrography and Ocean Sciences 177, 45 p.
  120. Polyakov, I.V., Pnyushkov, A.V., and Timokhov, L.A. (2012): Warming of the intermediate Atlantic water of the Arctic Ocean in the 2000s; Journal of Climate, v. 25, p. 8362–8370, doi:10.1175/JCLI-D-12-00266.1
  121. Price, A. M., Coffin, M. R., Pospelova, V., Latimer, J. S. and Chmura, G. L. (2017): Effect of nutrient pollution on dinoflagellate cyst assemblages across estuaries of the NW Atlantic; Marine Pollution Bulletin, v. 121, p. 339–351.
  122. Rahmstorf, S., Box, J.E., Feulner, G., Mann, M.E., Robinson, A., Rutherford, S. and Schaffernicht, E.J. (2015): Exceptional twentieth-century slowdown in Atlantic Ocean overturning circulation; Nature Climate Change, v. 5, p. 475–480. Doi:10.1038/nclimate2554
  123. Raven, J. A., and Falkowski, P. G. (1999): Oceanic sinks for atmospheric C02. plant cell and environment, v. 22, p. 741–755. doi:10.1046/j.1365-3040.1999.00419.x
  124. Rhein, M., Rintoul, S.R., Aoki, S., Campos, E., Chambers, D., Feely, R.A, Gulev, S., Johnson, G.C, Josey, S.A., Kostianoy, A., Mauritzen, C., Roemmich, D., Talley, L.D. and Wang, F. (2013): Observations: Ocean; in Climate Change 2013: The Physical Science Basis; Contribution of Working Group I to the Fifth Assessment Report of the Intergovernmental Panel on Climate Change, (ed.) T.F. Stocker, D. Qin, G.-K. Plattner, M. Tignor, S.K. Allen, J. Boschung, A. Nauels, Y. Xia, V. Bex and P.M. Midgley; Cambridge University Press, Cambridge, United Kingdom and New York, NY, USA, p. 255–315.
  125. Riser, S.C., Freeland, H.J., Roemmich, D., Wijffels, S., Troisi, A., Belbeoch, M., Gilbert, D., Xu, J., Pouliquen, S., Thresher, A., Le Traon, P.-Y., Maze, G., Klein, B., Ravichandran, M., Grant, F., Poulain, P.-M., Suga, T., Lim, B., Sterl, A., Sutton, P., Mork, K.-A., Vélez-Belchí, P. J., Ansorge, I., King, B., Turton, J., Baringer, M. and Jayne, S.R. (2016): Fifteen years of ocean observations with the global Argo array; Nature Climate Change, v. 6, p. 145–153. doi:10.1038/nclimate2872
  126. Ritz, C., Edwards, T., Durand, G., Payne, A., Peyaud V. and Hindmarsh, R. (2015): Potential sea-level rise from Antarctic ice-sheet instability constrained by observations; Nature, v. 528, p. 115–118. doi:10.1038/nature16147
  127. Saba, V.S., Griffies, S.M., Anderson, W.G., Winton, M., Alexander, M.A., Delworth, T.L., Hare, J.A., Harrison, M.J., Rosati, A., Vecchi, G.A. and Zhang, R. (2016): Enhanced warming of the Northwest Atlantic Ocean under climate change, Journal of Geophysical Research: Oceans, v. 121, p. 118–132. doi:10.1002/2015JC011346
  128. Sabine, C.L., Feely, R.A., Gruber, N., Key, R.M., Lee, K., Bullister, J.L., Wanninkhof, R., Wong, C.S., Wallace, D.W.R., Tilbrook, B., Millero, F.J., Peng, T.-H., Kozyr, A., Ono, T. and Rios, A.F. (2004): The oceanic sink for anthropogenic CO2; Science, v. 305, p. 367–371.
  129. Sanford, T., Frumhoff, P. C., Luers, A. and Gulledge, J. (2014): The climate policy narrative for a dangerously warming world; Nature Climate Change, v. 4, p. 164–166. doi:10.1038/nclimate2148
  130. Schmidtko, S., Stramma, L. and Visbeck, M. (2017): Decline in global oceanic oxygen content during the past five decades; Nature, v. 542, p. 335–339.
  131. Sgubin, G., Swingdeouw, D., Drijfhout, S., Mary, Y. and Bennabi, A. (2017): Abrupt cooling over the North Atlantic in modern climate models; Nature Communications, v. 8, 12 p. doi:10.1038/ncomms14375
  132. Shadwick, E.H., Thomas, H., Azetsu-Scott, K., Greenan, B.J.W., Head, E. and Horne, E. (2011): Seasonal variability of dissolved inorganic carbon and surface water pCO2 in the Scotian Shelf region of the Northwestern Atlantic; Marine Chemistry, v. 124, p. 23–37, doi:10.1016/j.marchem.2010.11.004
  133. Shepherd, T. (2014): Atmospheric circulation as a source of uncertainty in climate change projections; Nature Geosciences, v. 7, p. 703–708. doi:10.1038/NGEO2253
  134. Smith, M., Stammerjohn, S., Persson, O., Rainville, L., Liu, G., Perrie, W., Robertson, R., Jackson, J. and Thomson, J. (2018): Episodic reversal of autumn ice advance caused by release of ocean heat in the Beaufort Sea. Journal of Geophysical Research: Oceans, v. 123, p. 3164–3185. doi:10.1002/2018JC013764
  135. Sou, T. and Flato, G. (2009): Sea Ice in the Canadian Arctic Archipelago: modeling the past (1950–2004) and the future (2041–60); Journal of Climate, v. 22, p. 2181–2198. doi:10.1175/2008JCLI2335.1
  136. Squire, V.A. (2007): Of ocean waves and sea-ice revisited; Cold Regions Science and Technology, v. 49, p. 110–133.
  137. Steiner, N., Azetsu-Scott, K., Hamilton, J., Hedges, K., Hu, X., Janjua, M.Y., Lavoie, D., Loder, J., Melling, H., Merzouk, A., Perrie, W., Peterson, I., Scarratt, M., Sou, T. and Tallmann, R. (2015): Observed trends and climate projections affecting marine ecosystems in the Canadian Arctic; Environmental Reviews, v. 23, p. 191–239. doi:10.1139/er-2014-0066
  138. Sweet, W.V., Kopp, R.E., Weaver, C.P., Obeysekera, J., Horton, R.M., Thieler, E.R. and Zervas, C. (2017): Global and regional sea level rise scenarios for the United States; NOAA Technical Report NOS CO-OPS 083, Silver Spring, Maryland.
  139. Thomas, A.C., Pershing, A.J., Friedland, K.D., Nye, J.A., Mills, K.E., Alexander, M.A., Record, N.R., Weatherbee, R. and Henderson, M.E. (2017): Seasonal trends and phenology shifts in sea surface temperature on the North American northeastern continental shelf; Elementa Science of the Anthropocene, v. 5. Doi:10.1525/elementa.240
  140. Thomson, J. and Rogers, W.E. (2014): Swell and sea in the emerging Arctic Ocean; Geophysical Research Letters, v. 41, p. 3136–3140. doi:10.1002/2014GL05998
  141. Thomson, R.E., Bornhold, B.D. and Mazzotti, S. (2008): An examination of the factors affecting relative and absolute sea level in coastal British Columbia; Canadian Technical Report of Hydrography and Ocean Sciences 260, 49 p. <http://www.dfo-mpo.gc.ca/Library/335209.pdf>.
  142. Timmermans, M.-L., Ladd, C., and Wood, K. (2018): Sea surface temperature. Bulletin of the American Meteorological Society, v. 99, p. S150–S152. doi: 10.1175/2018BAMSStateoftheClimate.1
  143. Tremblay, J.-É., Anderson, L.G., Matrai, P., Bélanger, S., Michel, C., Coupel, P. and Reigstad, M. (2015): Global and regional drivers of nutrient supply, primary production and CO2 drawdown in the changing Arctic Ocean; Progress in Oceanography, v. 139, p. 171–196. doi:10.1016/j.pocean.2015.08.009
  144. Tremblay, J.-É., Bélanger, S., Barber, D.G., Asplin, M., Martin, J., Gagnon, J., Fortier, L., Darnis, G., Gratton, Y., Williams, W.J., Link, H., Archambault, P., Philippe, B. and Gosselin, M. (2011): Climate forcing multiplies biological productivity in the coastal Arctic Ocean; Geophysical Research Letters, v. 38. doi:10.1029/2011GL048825
  145. Tremblay, J.-É., Sejr, M., Bélanger, S., Devred., E., Archambault, P., Arendt, K. and Merkel, F. R. (2018): Marine ecosystems; in Adaptation Actions for a Changing Arctic: Perspectives from the Baffin Bay/Davis Strait Region; Arctic Monitoring and Assessment Programme (AMAP), Oslo, Norway, p. 139–152.
  146. UNEP (2017). The Emissions Gap Report 2017. United Nations Environment Programme (UNEP), Nairobi.
  147. Vancoppenolle, M., Meiners, K.M., Michel, C., Bopp, L., Brabant, F., Carnat, G., Delille, B., Lannuzel, D., Madec, G., Moreau, S., Tison, J.L. and van der Merwe, P. (2013): Role of sea ice in global biogeochemical cycles: emerging views and challenges; Quaternary Science Reviews, v. 79, p. 207–230.
  148. Wadhams, P., Squire, V.A., Goodman, D.J., Cowan, A.M. and Moore, S.C. (1988): The attenuation rates of ocean waves in the marginal ice zone; Journal of Geophysical Research: Oceans, v. 93, p. 6799–6818.
  149. Wang, L., Perrie, W., Blokhina, M., Long, Z., Toulany, B., and Zhang, M. (2018): The impact of climate change on the wave climate in the Gulf of St. Lawrence. Ocean Modelling. v. 128, p. 87–101. doi.org/10.1016/j.ocemod.2018.06.003
  150. Wang, X., and Swail, V. (2001): Changes of extreme wave heights in Northern Hemisphere oceans and related atmospheric circulation regimes. Journal of Climate, v. 14, p. 2204–2221, doi:10.1175/1520-0442(2001)014<2204:COEWHI>2.0.CO;2
  151. Wang, X., and Swail, V. (2002): Trends of Atlantic wave extremes as simulated in a 40-yr wave hindcast using kinematically reanalyzed wind fields. Journal of Climate, v. 15, p. 1020–1035, doi:10.1175/1520-0442(2002)015<1020:TOAWEA>2.0.CO;2
  152. Wang, X.L., Feng, Y., Chan, R. and Isaac, V. (2016): Inter-comparison of extratropical cyclone activity in nine reanalysis datasets; Atmospheric Research, v. 181, p. 133–153. doi:10.1016/j.atmosres.2016.06.010
  153. Wang, X.L., Feng, Y. and Swail, V.R. (2012): North Atlantic wave height trends as reconstructed from the 20th century reanalysis; Geophysical Research Letters, v. 39, 6 p. doi:10.1029/2012GL053381
  154. Wang, X.L., Feng, Y. and Swail, V.R. (2014): Changes in global ocean wave heights as projected using multimodel CMIP5 simulations; Geophysical Research Letters, v. 41, p. 1026–1034. doi:10.1002/2013GL058650
  155. Wang, X.L., Feng, Y., Swail, V.R. and Cox, A. (2015): Historical Changes in the Beaufort–Chukchi–Bering Seas Surface Winds and Waves, 1971–2013; Journal of Climate, v. 28, p. 7457–7469. doi:10.1175/JCLI-D-15-0190.1
  156. Wang, X.L., Swail, V.R. and Zwiers, F.W. (2006): Climatology and changes of extra-tropical cyclone activity: Comparison of ERA-40 with NCEP/NCAR Reanalysis for 1958–2001; Journal of Climate, v. 19, p. 3145–3166. doi:10.1175/JCLI3781.1
  157. Whitney, F.A., Freeland, H.J. and Robert, M. (2007): Persistently declining oxygen levels in the interior waters of the eastern subarctic Pacific; Progress in Oceanography, v. 75, p. 179–199.
  158. Woodgate, R.A., Weingartner, T.J. and Lindsay, R. (2012): Observed increases in Bering Strait oceanic fluxes from the Pacific to the Arctic from 2001 to 2011 and their impacts on the Arctic Ocean water column; Geophysical Research Letters, v. 39. doi:10.1029/2012gl054092
  159. Wu, L., Cai, W., Zhang, L., Nakamura, H., Timmermann, A., Joyce, T., McPhaden, M.J., Alexander, M., Qiu, B., Visbeck, M., Chang, P. and Giese, B. (2012): Enhanced warming over the global subtropical western boundary currents; Nature Climate Change, v. 2, p. 161–166. doi:10.1038/nclimate1353
  160. Yamamoto-Kawai, M., McLaughlin, F.A., Carmack, E.C., Nishino, S. and Shimada, K. (2009): Aragonite undersaturation in the Arctic Ocean: effects of ocean acidification and sea ice melt; Science, v. 326, p. 1098–1100. doi:10.1126/science.1174190
  161. Yashayaev, I., Head, E.J.H., Azetsu-Scott, K., Wang, Z., Li, W.K.W., Greenan, B.J.W., Anning, J. and Punshon, S. (2014): Oceanographic and environmental conditions in the Labrador Sea during 2012; DFO Canadian Science Advisory Secretariat, Research Document 046, 24 p.
  162. Yashayaev, I. and Loder, J.W. (2016): Recurring replenishment of Labrador Sea Water and associated decadal-scale variability; Journal of Geophysical Research: Oceans, v. 121, p. 8095–8114. doi:10.1002/2016JC012046
  163. Yashayaev, I. and Loder, J.W. (2017): Further intensification of deep convection in the Labrador Sea in 2016; Geophysical Research Letters, v. 44, p. 1429–1438. doi: 10.1002/2016GL071668
  164. Yasunaka, S., Ono, T., Nojiri, Y., Whitney, F.A., Wada, C., Murata, A., Nakaoka, S. and Hosoda, S. (2016): Long-term variability of surface nutrient concentrations in the North Pacific; Geophysical Research Letters, v. 43, p. 3389–3397. doi:10.1002/2016GL068097
  165. Yeats, P., Ryan, S. and Harrison, W.G. (2010): Temporal trends in nutrient and oxygen concentrations in the Labrador Sea and on the Scotian Shelf; Atlantic Zone Monitoring Program Bulletin, v. 9, p. 23–27. <http://waves-vagues.dfo-mpo.gc.ca/Library/365688.pdf>.
  166. Yin, J. (2012): Century to multi-century sea level rise projections from CMIP5 models; Geophysical Research Letters, v. 39. doi:10.1029/2012GL052947
  167. Yin, J., Griffies, S.M. and Stouffer, R.J. (2010): Spatial variability of sea level rise in twenty-first century projections; Journal of Climate, v. 23, p. 4585–4607.
  168. Zaikova, E., Walsh, D.A., Stilwell, C.P., Mohn, W.W., Tortell, P.D. and Hallam, S.J. (2010): Microbial community dynamics in a seasonally anoxic fjord: Saanich Inlet, British Columbia; Environmental Microbiology, v. 12, p. 172–191. doi:10.1111/j.1462-2920.2009.02058.x
  169. Zhai, L., Greenan, B.J.W., Hunter J., James, T.S., Han, G., MacAulay, P. and Henton, J.A. (2015): Estimating sea-level allowances for Atlantic Canada using the Fifth Assessment Report of the IPCC; Atmosphere-Ocean, v. 53, p. 476–490. doi:10.1080/07055900.2015.1106401
  170. Zhai, L., Greenan, B., Hunter, J., James, T.S., Han, G., Thomson, R. and MacAulay, P. (2014): Estimating sea-level allowances for the coasts of Canada and the adjacent United States using the Fifth Assessment Report of the IPCC; Canadian Technical Report of Hydrography and Ocean Science 300, 146 p.
  171. Zweng, M.M., and Münchow, A. (2006): Warming and freshening of Baffin Bay, 1916–2003. Journal of Geophysical Research: Oceans, v. 111, C07016. doi:10.1029/2005JC003093.
Next

Changes in Canada's Regions in a National and Global Context