Figure 9.5: -


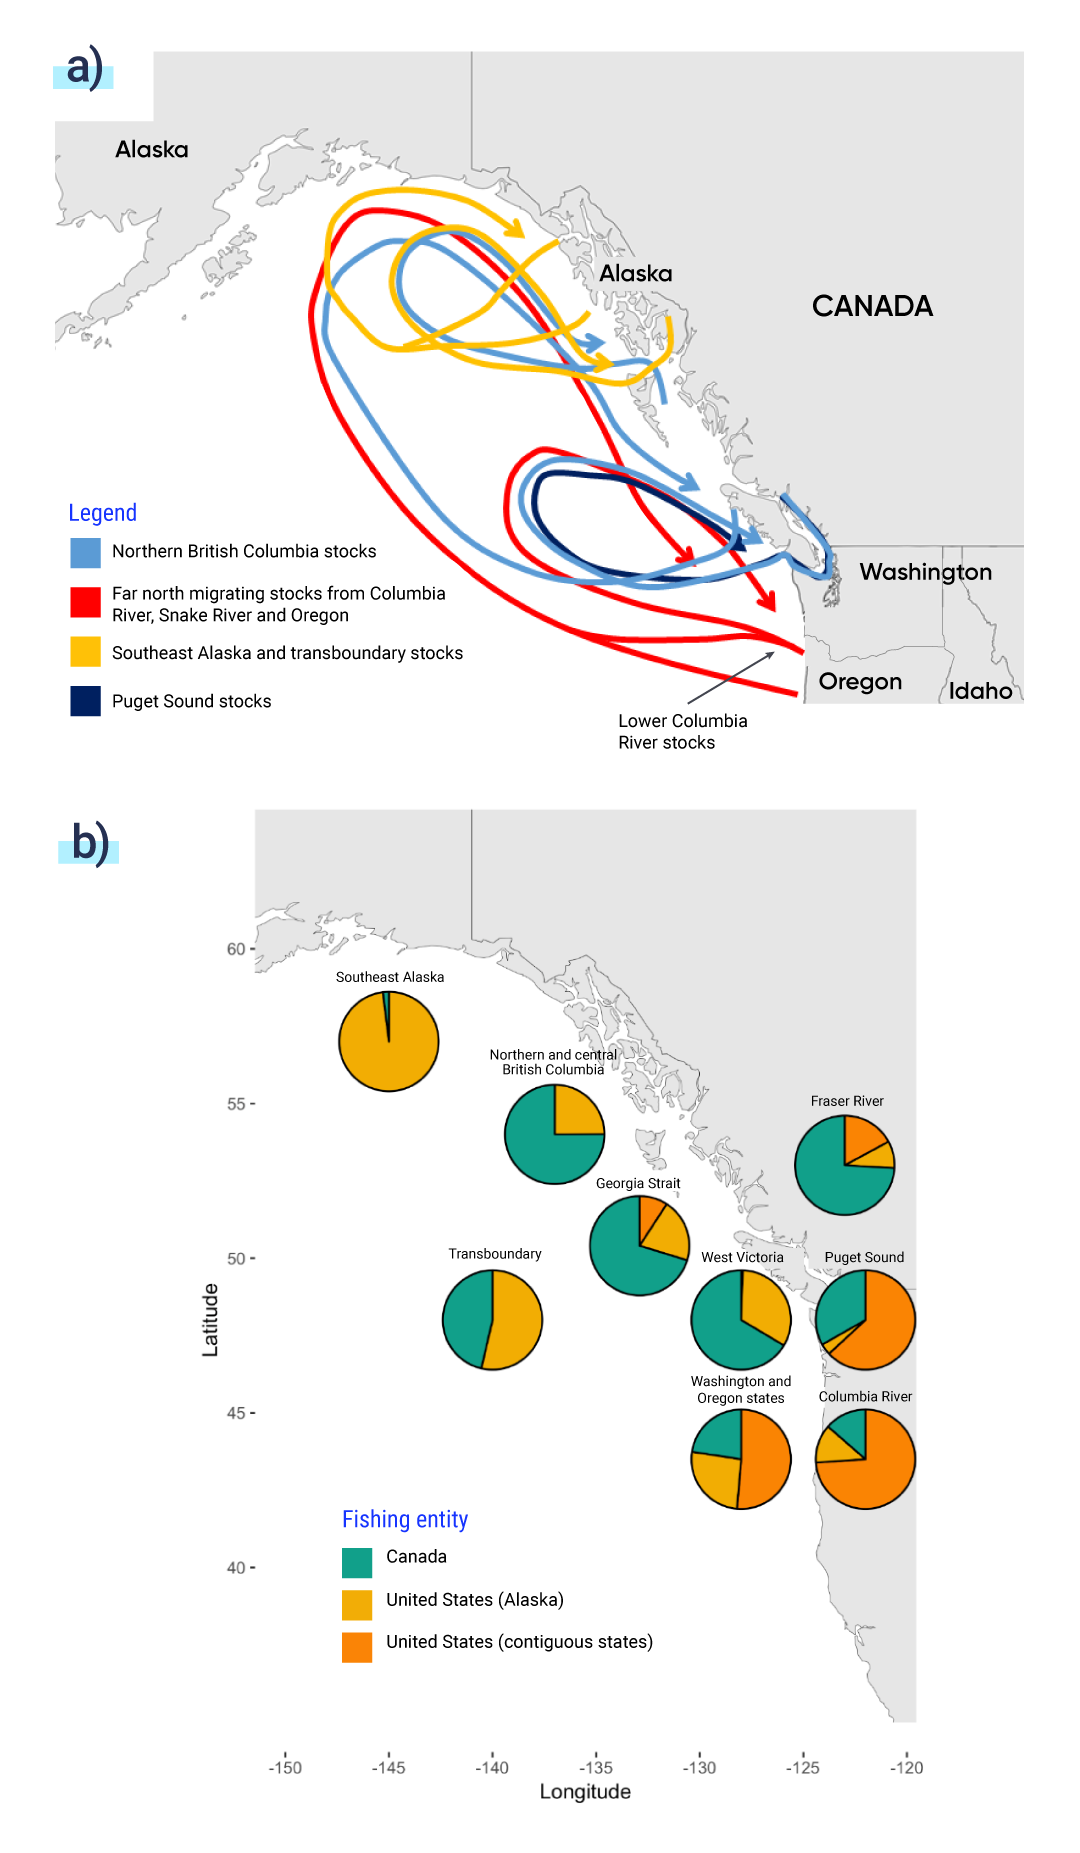
a) Migratory patterns of major Chinook salmon (Oncorhynchus tshawytscha) stock groups. Source: Adapted from the National Marine Fisheries Service, 2019. b) Average captures of regional Chinook salmon (Oncorhynchus tshawytscha) for the period 2009–2017 under managed fisheries of the Pacific Salmon Treaty. The values in the pie charts represent the proportion of each region’s major chinook stock captured by individual fishing entities (averaged across regional stocks), and do not include escapement. Data source: Pacific Salmon Commission, 2019.
Data source: Pacific Salmon Commission, 2019.