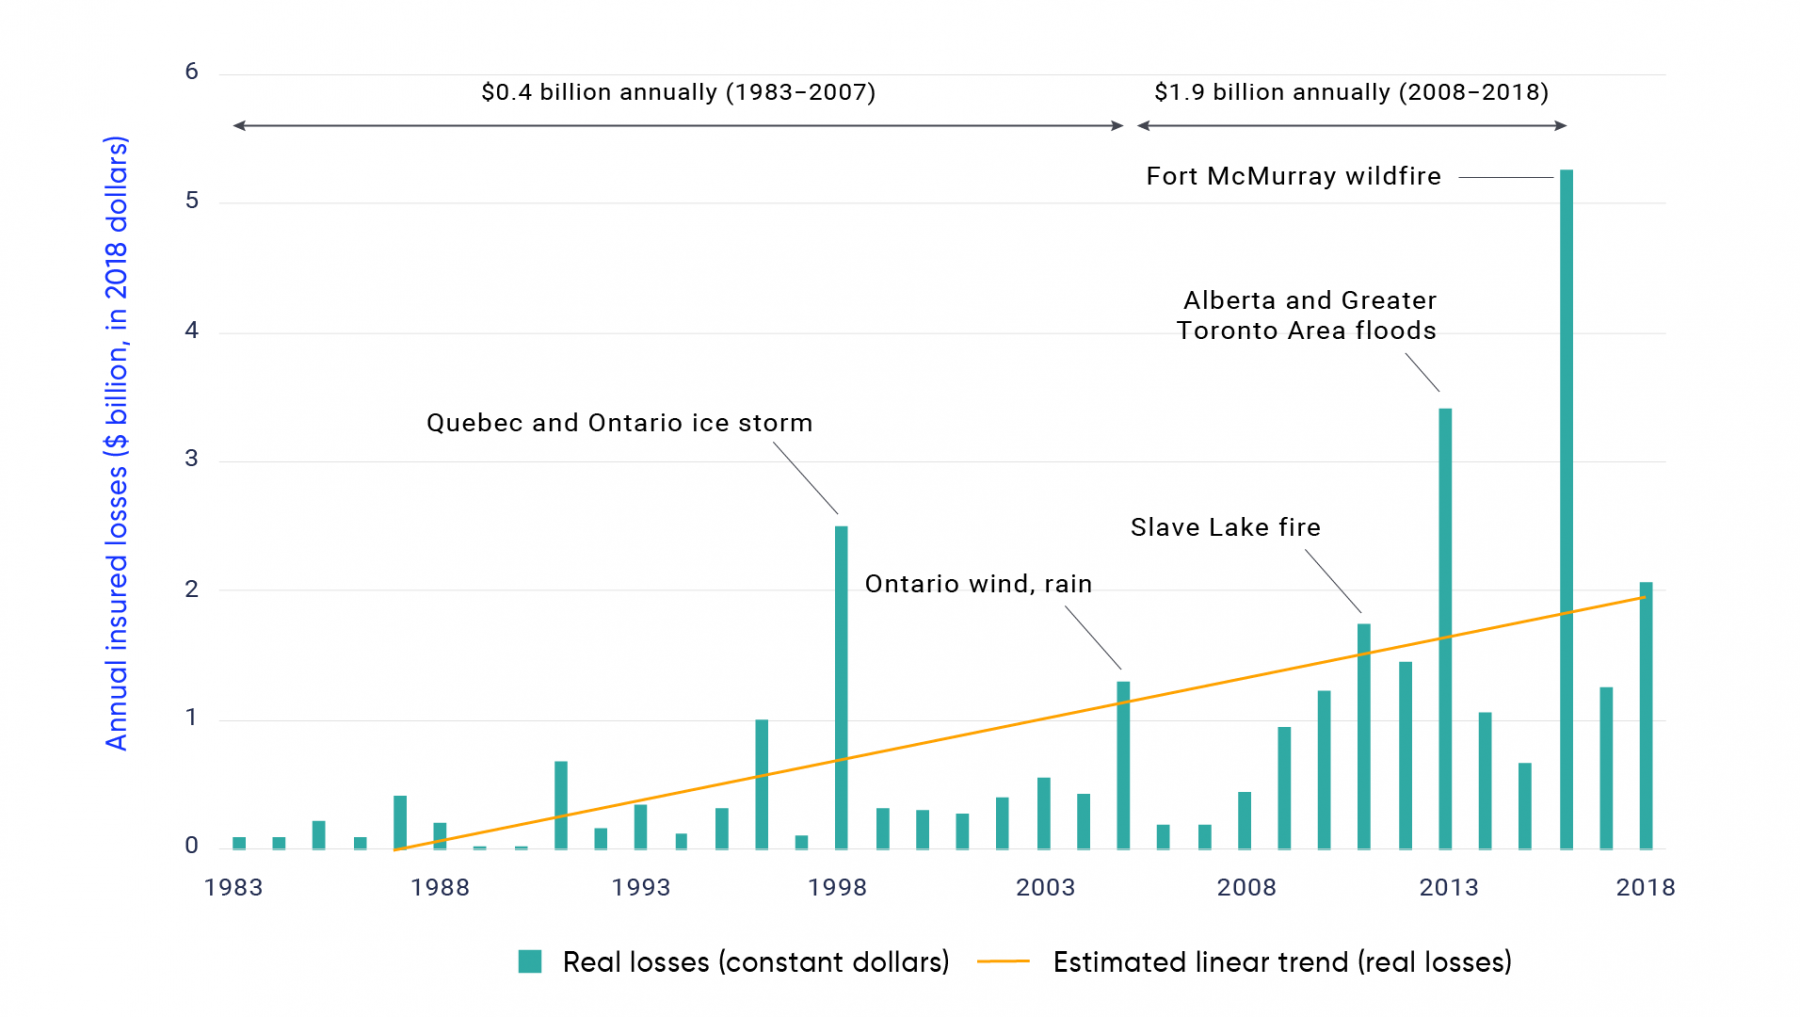
Figure 6.5: -


The figure shows annual insured losses plus adjustment expenses (in 2018 dollars) from extreme weather events in Canada over the period 1983‒2018. The height of the bars shows the total losses plus expenses from all extreme weather-related events in each year. The solid yellow line shows the estimated upward trend in insured losses plus adjustment expenses.
Data source: Insurance Bureau of Canada, 2018.