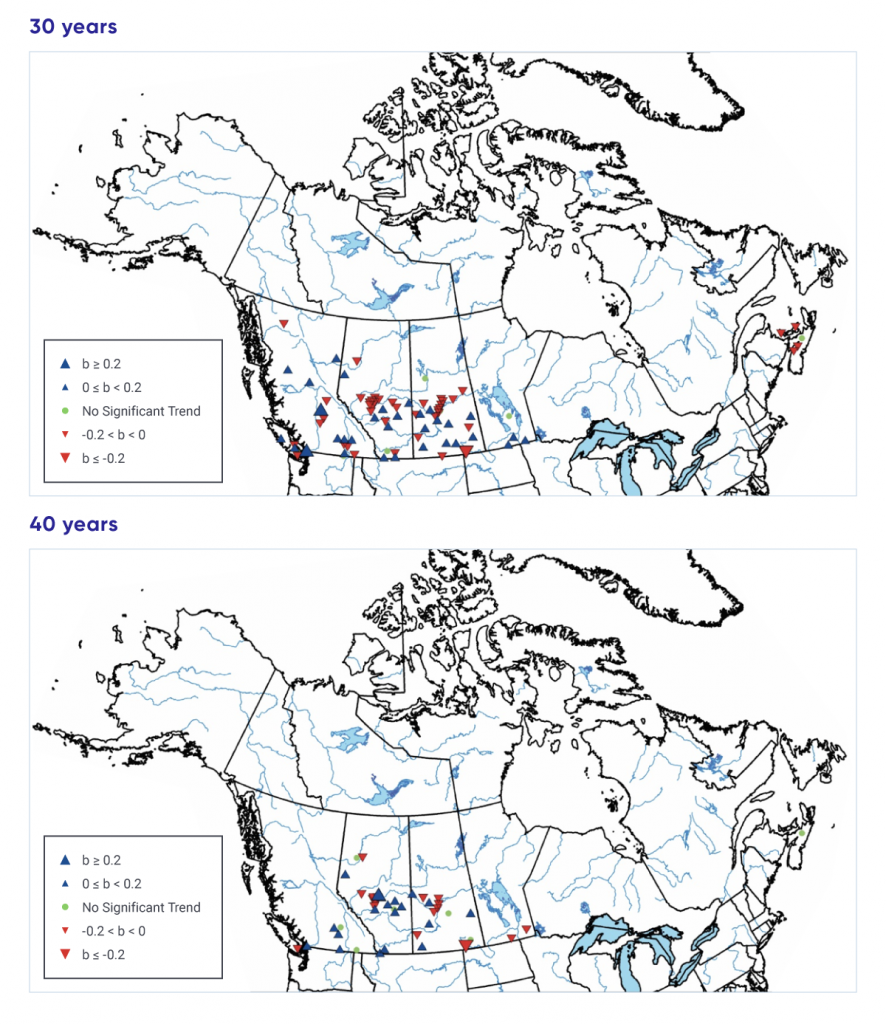
Trends for annual mean groundwater levels for 30-year (1976–2005, top) and 40-year (1966–2005, bottom) series. b represents the magnitude of the trend in metres per year. Significant trends denote that there is only a 10% possibility that such changes are due to chance.